Leaving PIMCO.com

You are now leaving the PIMCO website.

Skip to Main Content
PM Chartbook

Charting Public Credit With Mohit Mittal

Mohit Mittal, PIMCO’s CIO of Core Strategies, shows how public corporate credit has remained highly liquid and exhibited narrow bid-ask spread during recent periods of elevated volatility.

Bid-Ask Spreads Indicate No Significant Stress in Public Credit Market Liquidity

Recent Treasury sell-offs have sparked premature and unwarranted concerns about public fixed income valuations and liquidity, particularly in public credit.

Despite the volatility induced by recent tariff announcements, bond liquidity remains robust, with no material signs of stress in public IG credit.

As is typical during periods of heightened volatility, public credit (IG) bid-ask spreads have widened—a trend that has historically, at times, indicated a more challenging environment for liquidity. However, current spreads remain well within their long-term average range and are below the peaks seen during 2022’s volatility.

Investment grade (IG) bid-ask spread
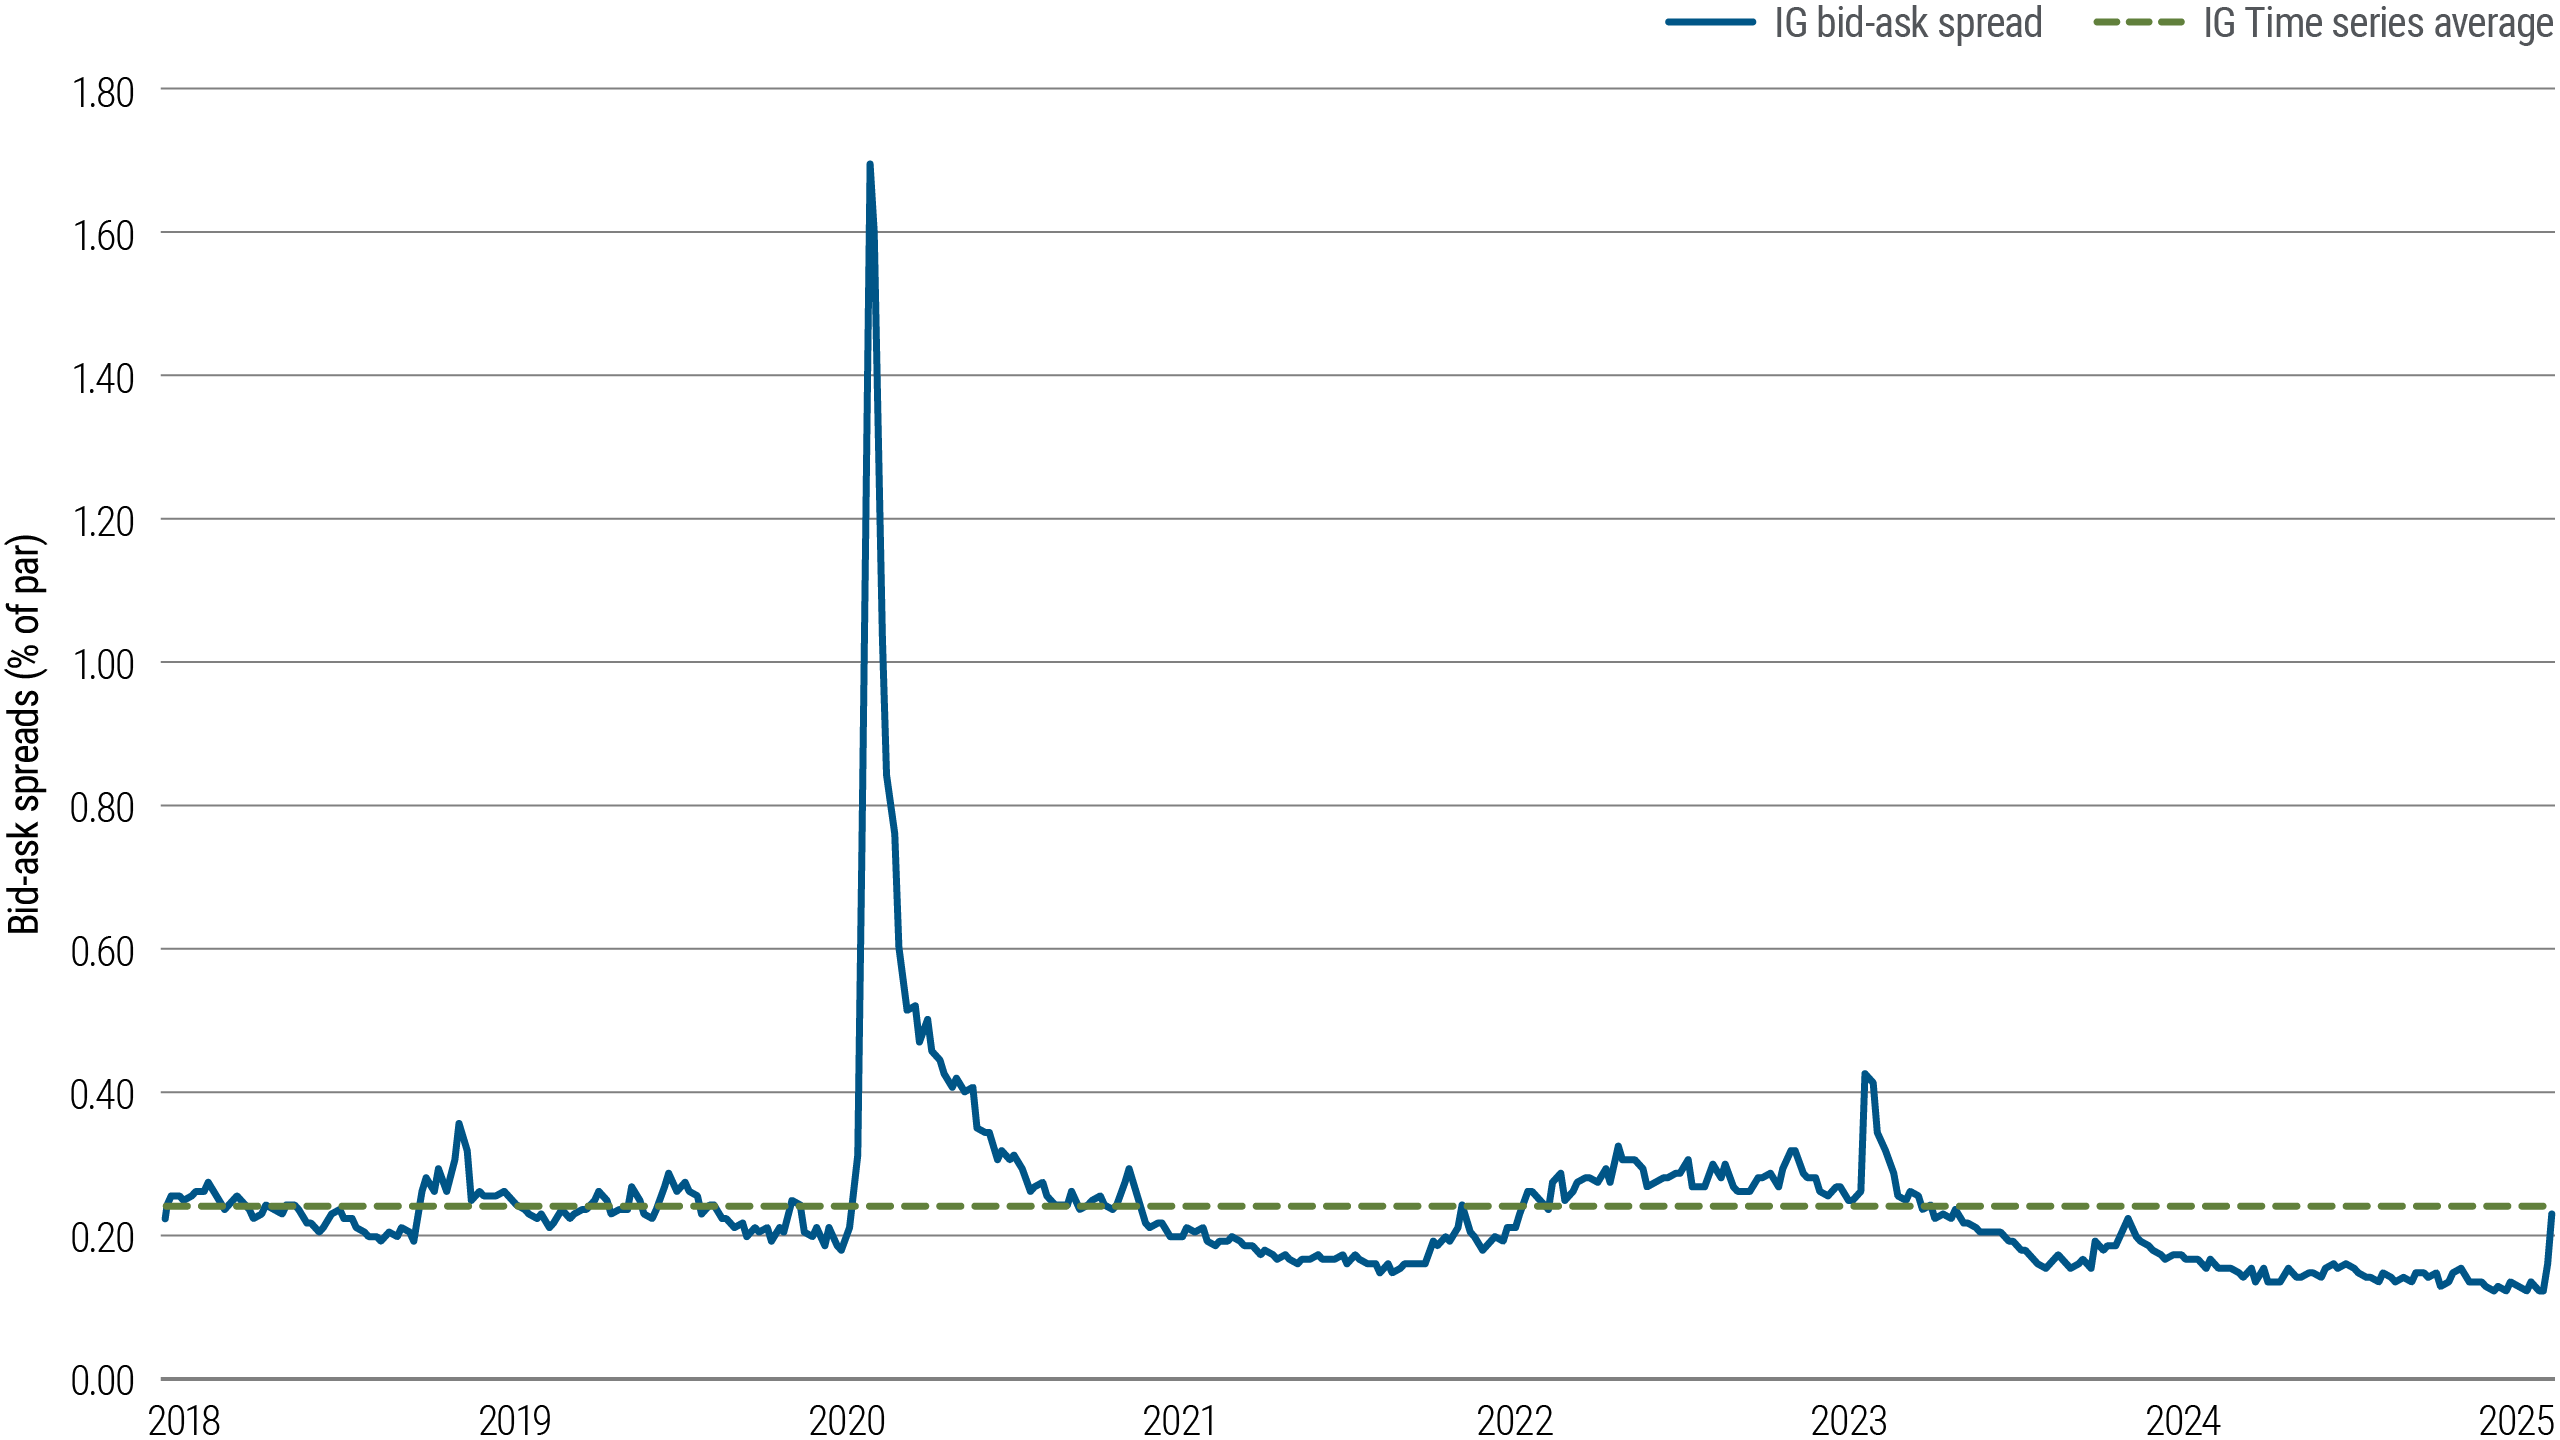
Investment grade (IG) bid-ask spread
Source: MarketAxess and Trace as of 22 April 2025. Time series average reflects CP+BASI, a group of indices that tracks bid-ask spreads across global credit, rates and emerging bond markets. These indices provide a useful gauge of general market liquidity as well as relative trading activity.

Public Credit Remained Relatively Stable While Tradeable BDCs Plunged

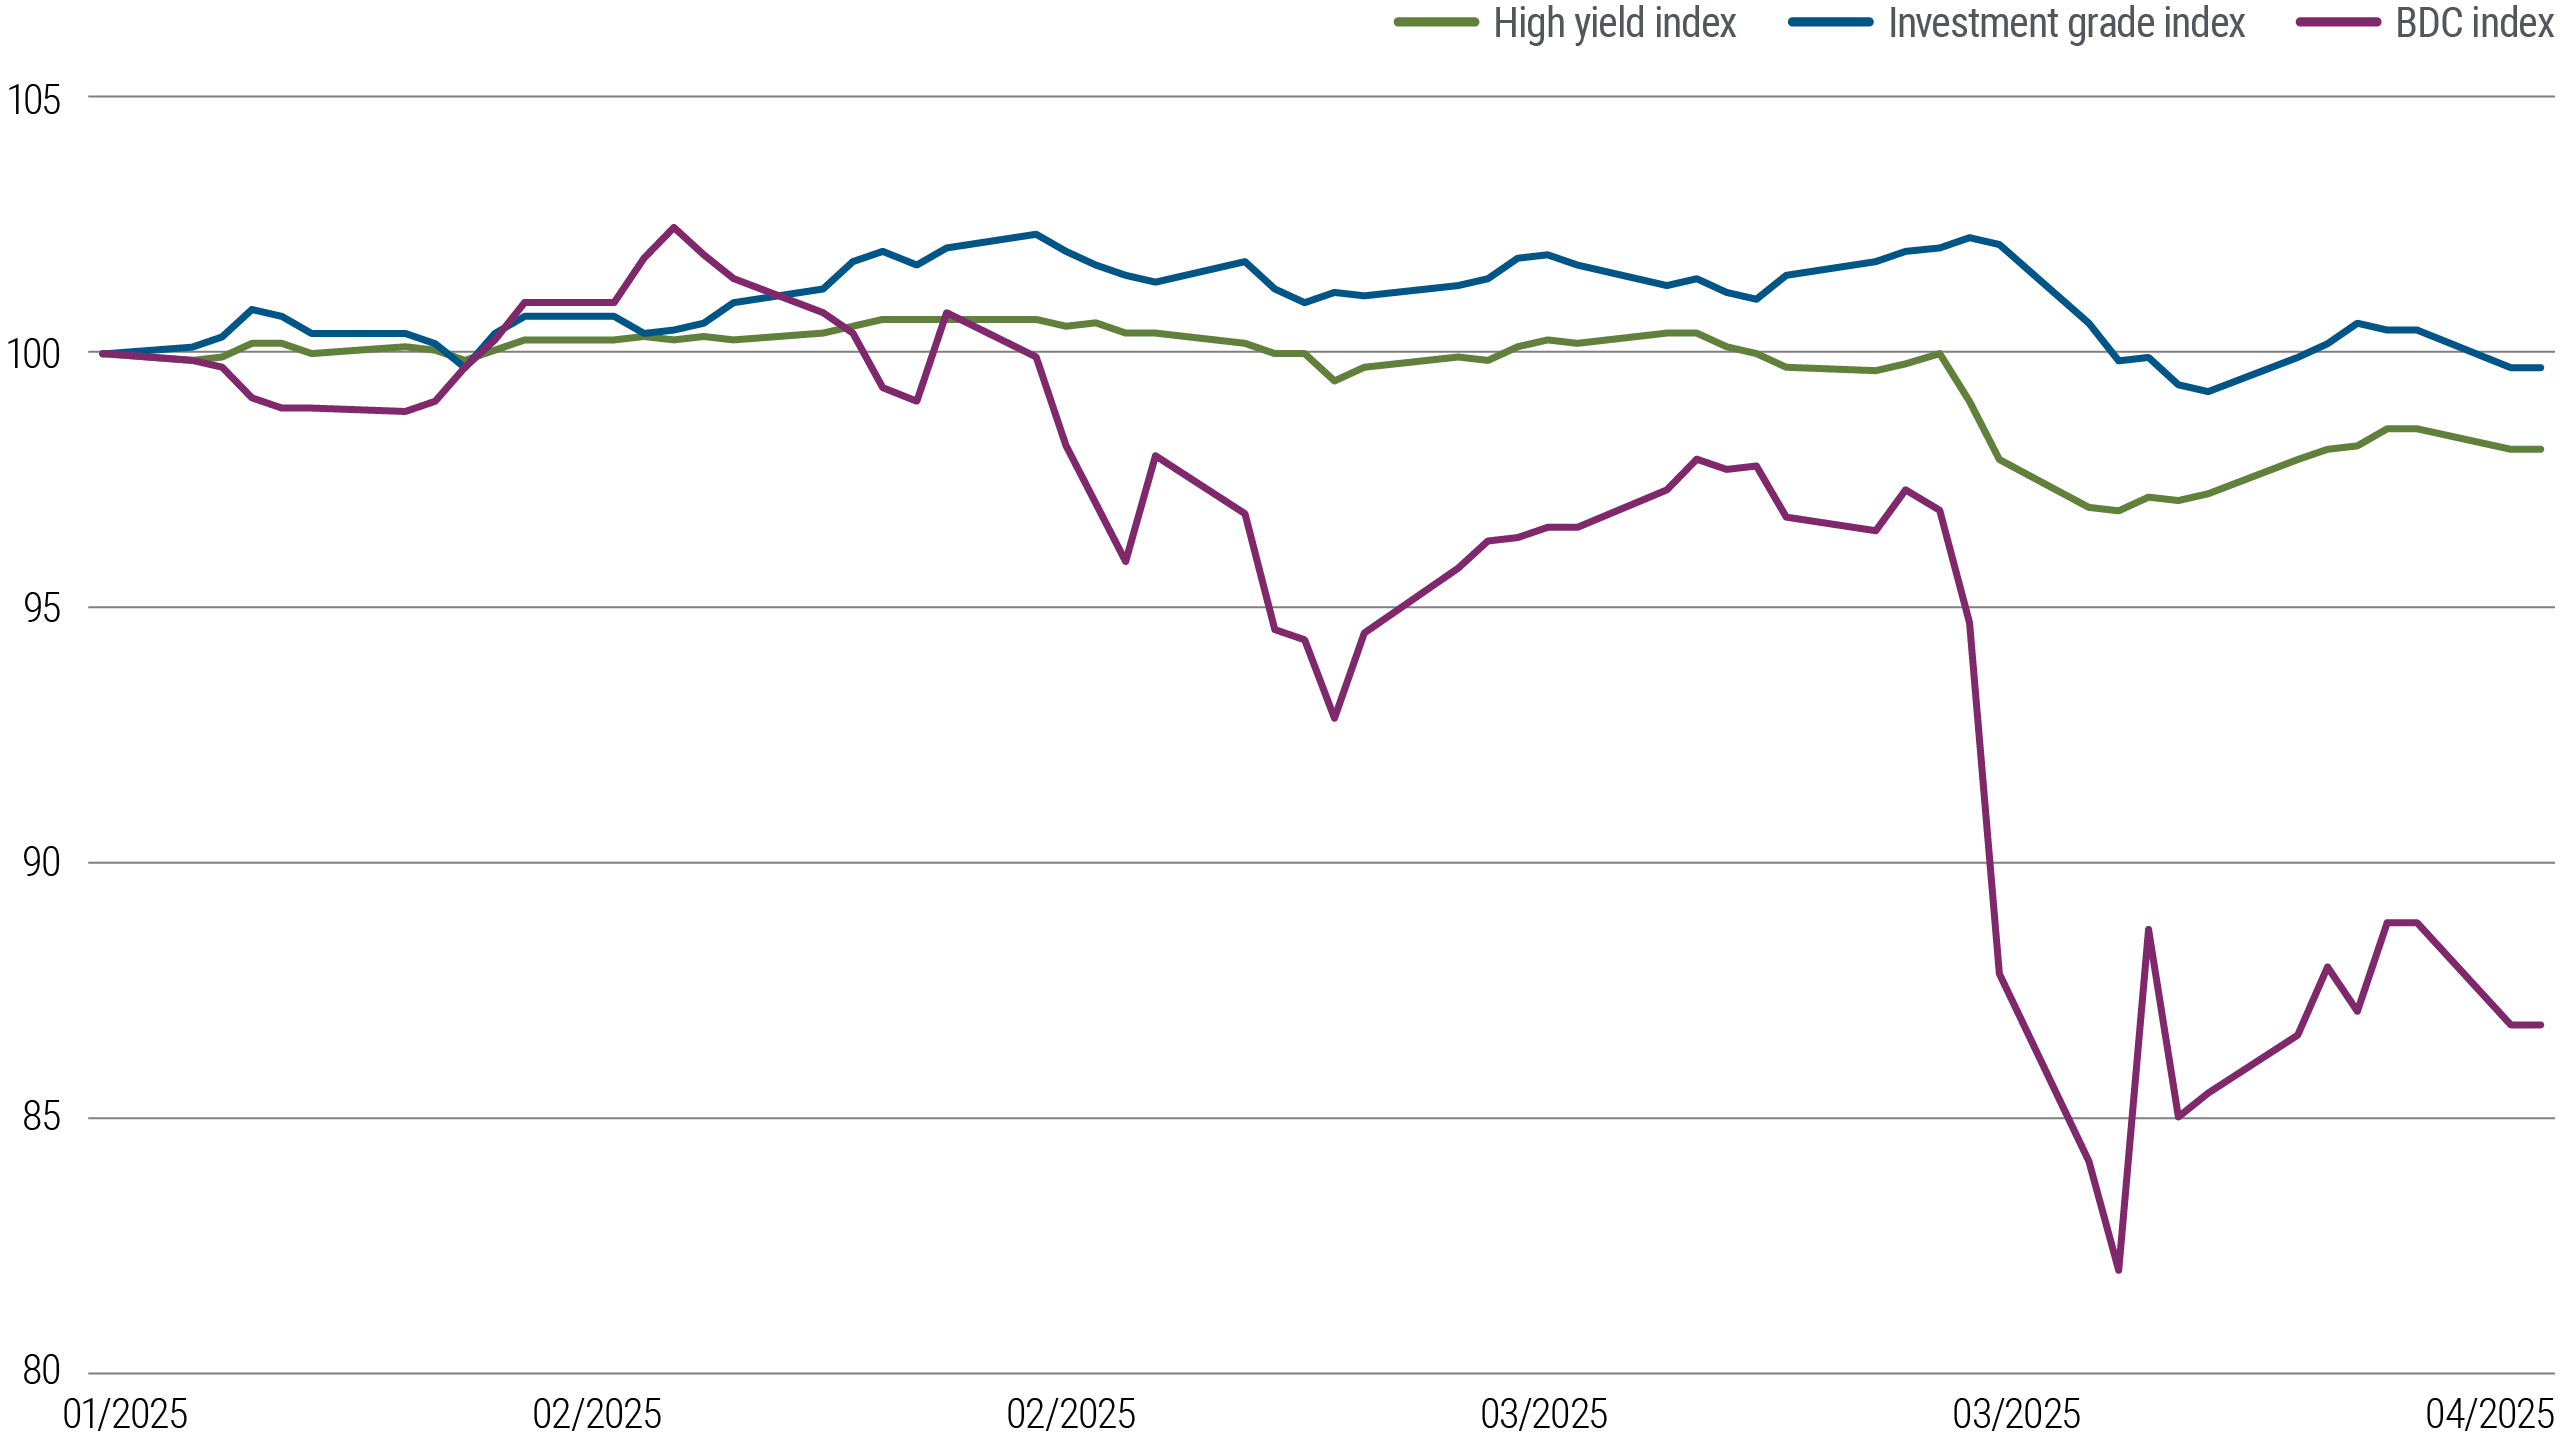
Since the end of January, the total returns of investment grade and high yield bonds have remained relatively stable, reinforcing our confidence in their resilience. In contrast, business development companies (BDCs), which invest in debt of private small- and mid-sized businesses and serve as a general indicator of less liquid private corporate credit markets, have seen significant declines. This drop highlights the negative impact of the current environment on the credit quality of the underlying holdings.

Total return drawdowns

Total return drawdowns
Source: MarketAxess, Trace, and S&P Business Development Companies Index as of 22 April 2025. High yield index reflects the Bloomberg U.S. Corporate High Yield Bond Index, an index that tracks the performance of the USD-denominated, high-yield, fixed-rate corporate bond market. Investment grade index reflects the Bloomberg U.S. Corporate Investment Grade Index, an index that tracks the performance of the U.S. investment grade, fixed-rate, taxable corporate bond market. BDC index reflects the S&P Business Development Companies Index that tracks leading business development companies that trade on major U.S. exchanges.

Public Credit Trading Volumes Remain Robust

Investment grade corporate (IGC) bond markets remain highly liquid, trading at tens of billions of dollars per day.

High trading volumes, along with low bid-ask spreads and stable prices have provided investors with a strong liquidity layer in their portfolios, especially relative to equities, which have seen meaningfully higher volatility.

IGC monthly trading volume
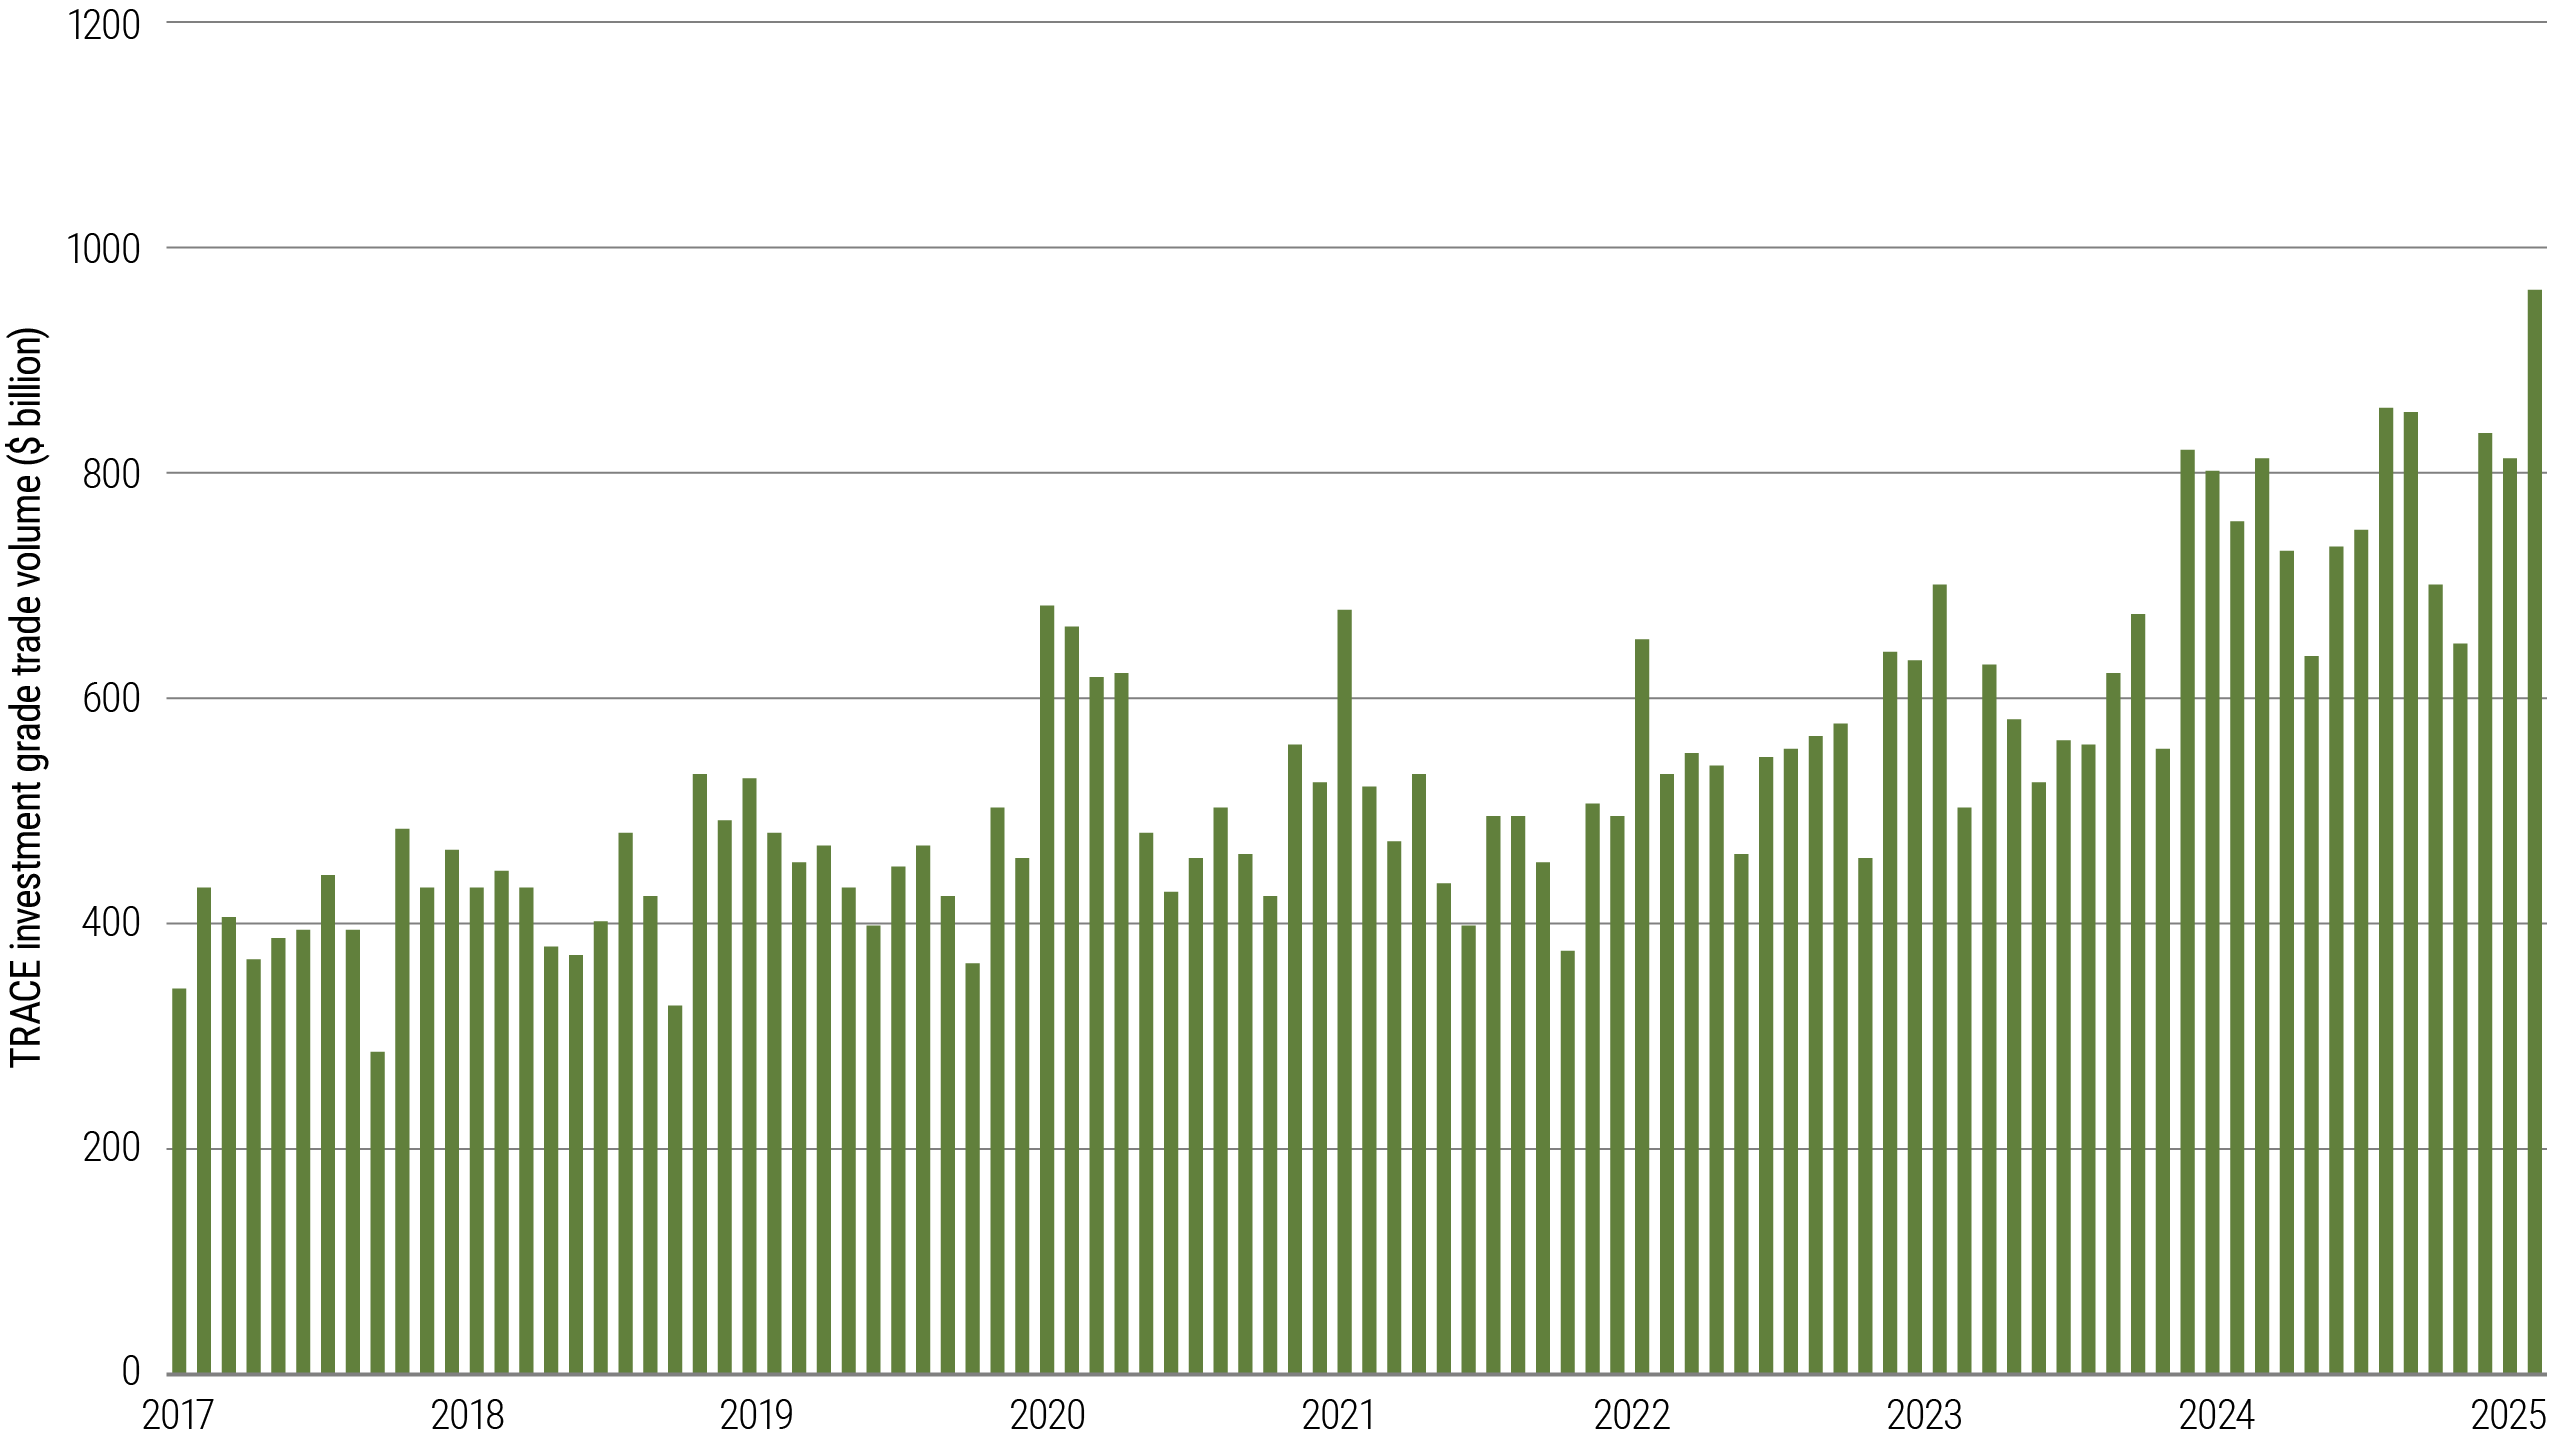
Source: MarketAxess and Trace as of 7 April 2025. Past performance is not a guarantee or a reliable indicator of future results. CP+ BASI is a group of indices that tracks bid-ask spreads across global credit, rates, and emerging bond markets. These indices provide a useful gauge of general market liquidity as well as relative trading activity.

Public Credit Yields Look Especially Attractive Today

Current yields in high-quality fixed income are not only stable in comparison to the high volatility of tradeable BDCs and equities, they are also particularly attractive compared to their historical levels. Investors may not only achieve equity-like returns without having to take up the associated volatility, but also maintain high liquidity levels without sacrificing quality.

Yield comparisons to historical levels
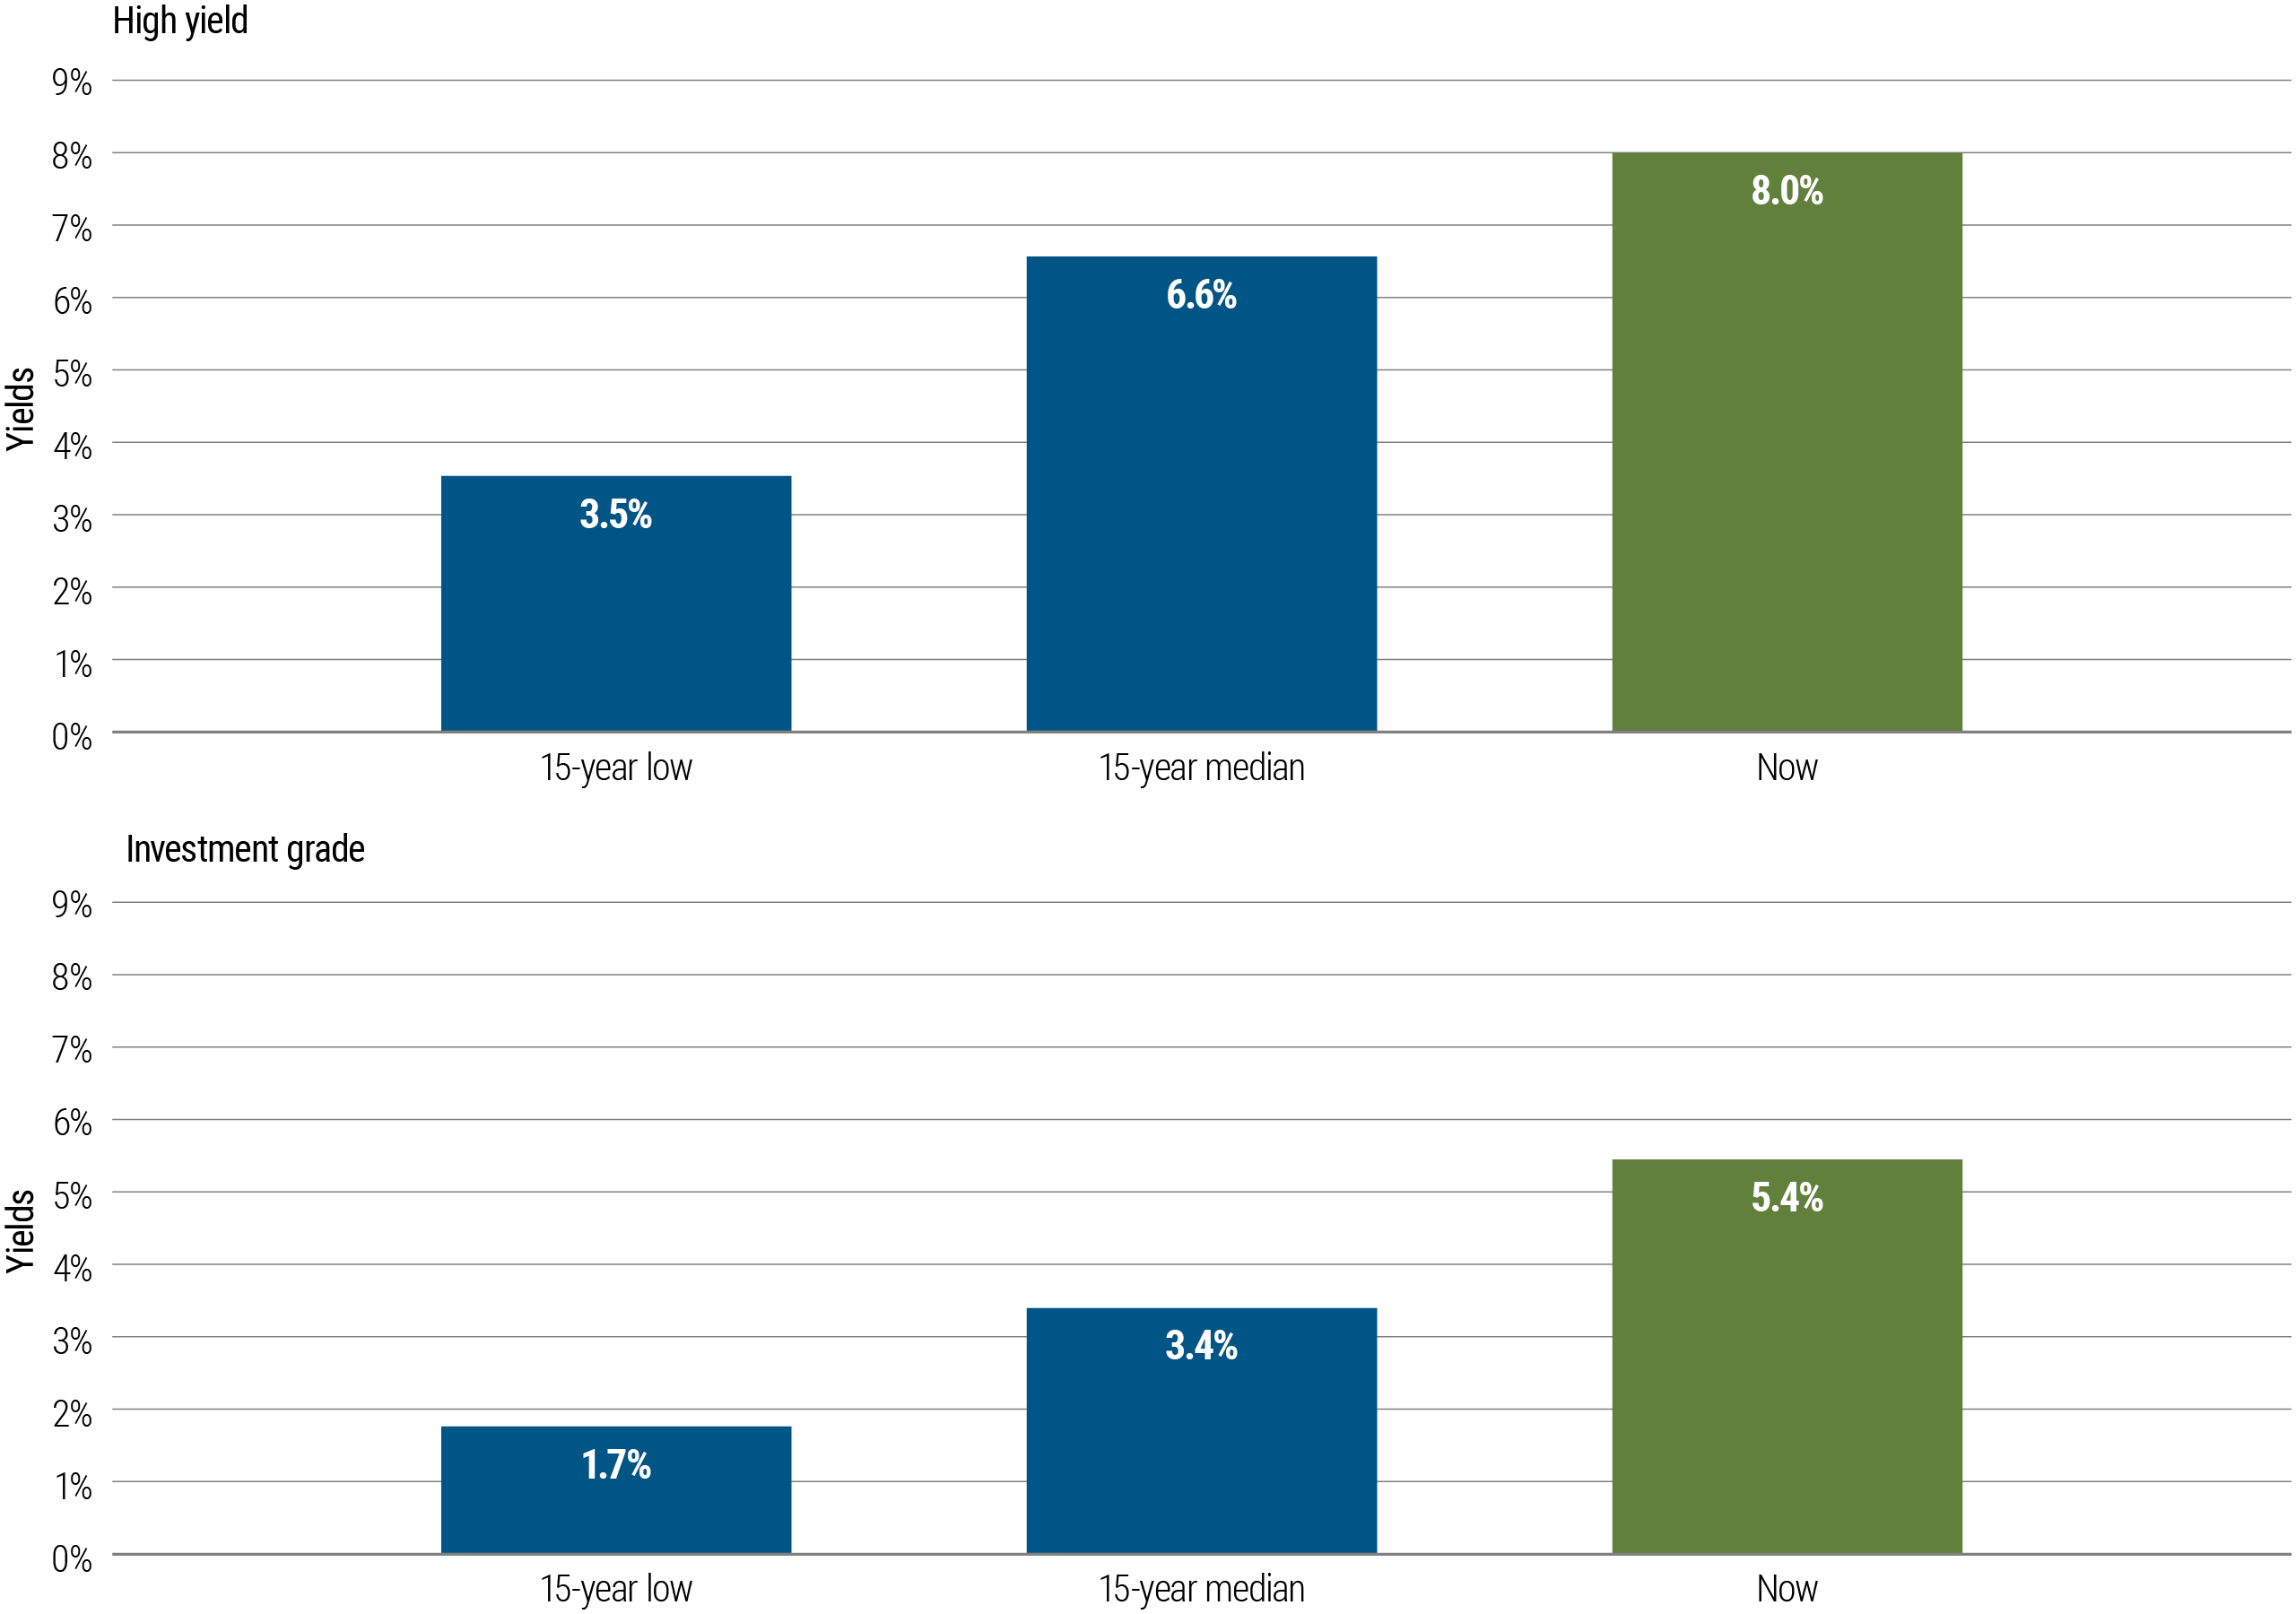
Source: MarketAxess and Trace as of 23 April 2025. Past performance is not a guarantee or a reliable indicator of future results. High yield chart reflects the LF98YW Index, which tracks the yield to worst of the U.S. high yield corporate bond market. Investment grade chart reflects the LUACYW Index, which tracks the yield to worst of the U.S. investment grade corporate bond market. Yield to Worst (YTW) is the estimated lowest potential yield that can be received on a bond without the issuer actually defaulting. The YTW is calculated by making worst-case scenario assumptions by calculating the returns that would be received if provisions, including prepayment, call, or sinking fund, are used by the bond’s issuer.

Looking for More?

Sign up to be notified about future editions of the PM Chartbook and related content from PIMCO.

Thank you

Your submission has been sent. We appreciate your interest in PIMCO.

Featured Participants

Tell us a little about you to help us personalize the site to your needs.

Terms and Conditions

Please read and acknowledge the following terms and conditions:

{{!-- Populated by JSON --}}

Select Your Location


Americas

Asia Pacific

  • Japan

Europe, Middle East & Africa

  • Europe
Back to top