
Monetary policy walks the inflation tightrope
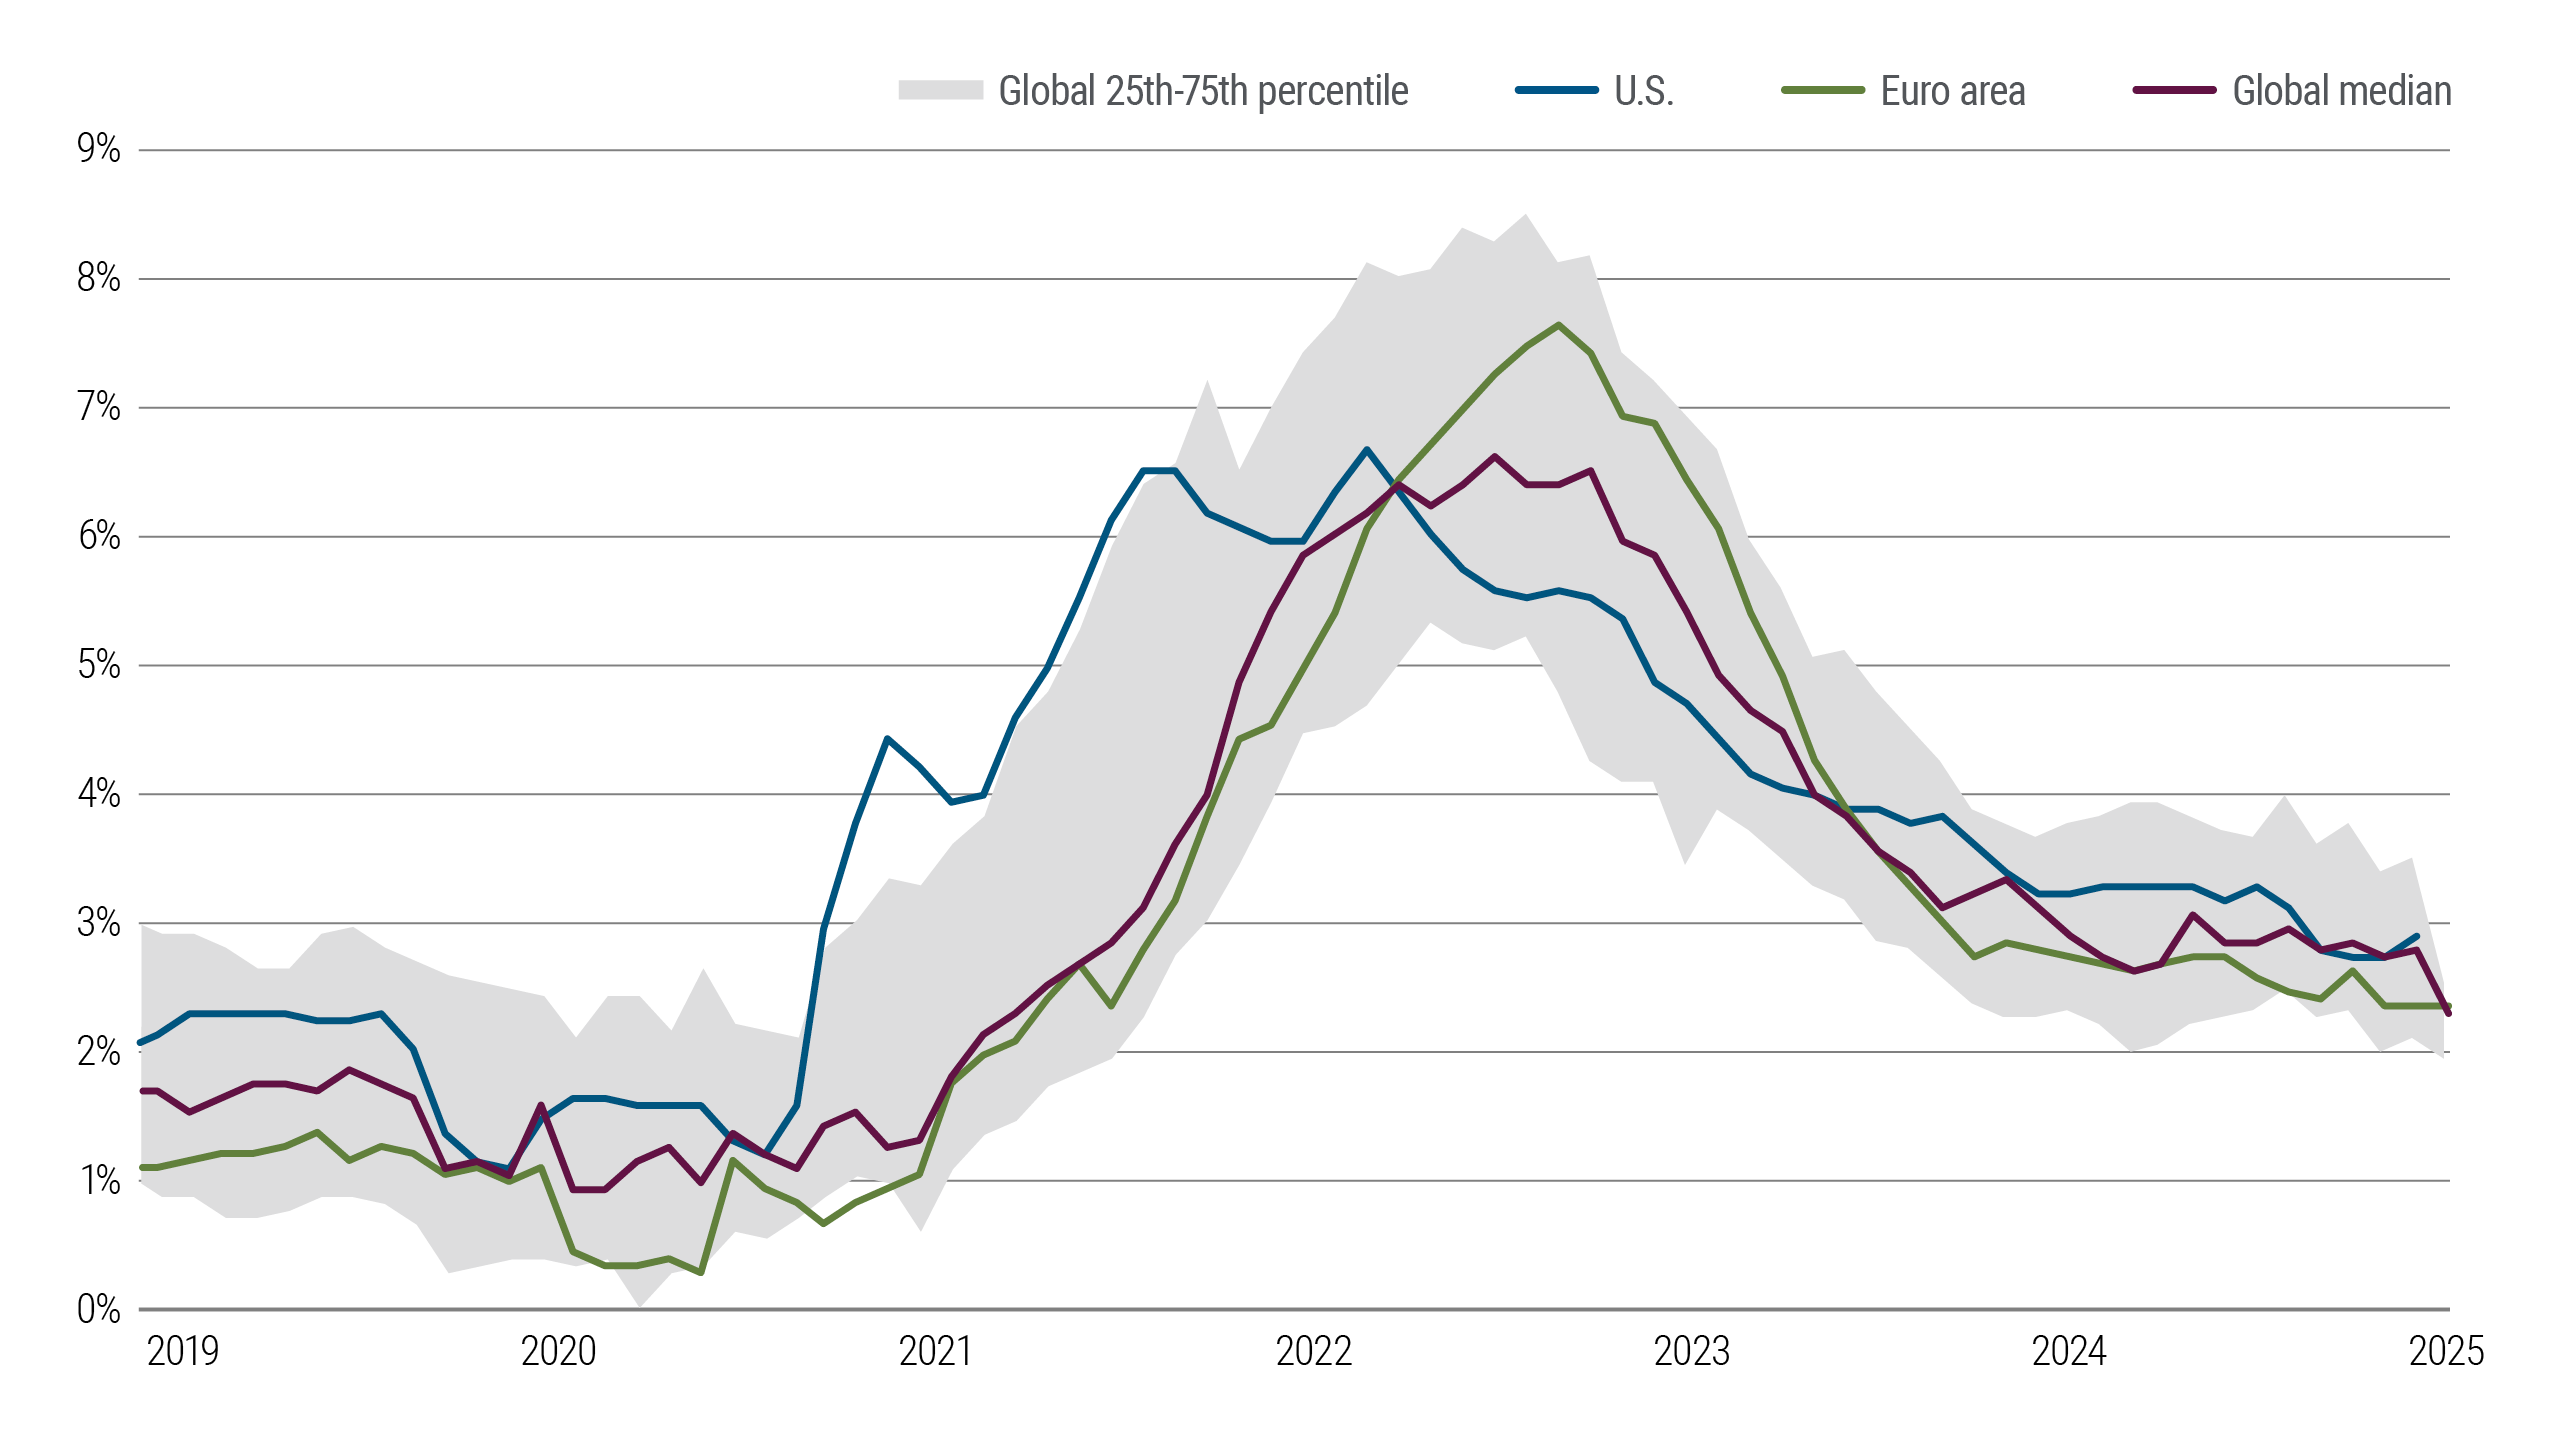
The balance of risks to the Federal Reserve’s dual mandate (price stability and maximum employment) prompted the central bank to lower its policy rate in September in an effort to bolster the economy and employment. However, U.S. inflation remains above the Fed’s target and is elevated relative to global peers.
We expect additional rate cuts, but not down to the near-zero levels that could rekindle high inflation. Well-anchored inflation expectations likely inform Fed decisions at least as much as current prices and recent trends do. Thus far, tariff-related price pressures do not appear to have significantly affected inflation expectations.
Global core CPI inflation
Bullish sentiment has returned to equity markets after a tariff-related dip: Stock prices don’t signal recession, but how much of this is froth?
Indeed, the U.S. equity market has remained both buoyant and bullish, but how much of this is froth?
Investors are getting little additional earnings yield by owning equities, versus what they would earn owning a nominal 10-year Treasury note. This suggests that bonds may offer better risk-adjusted returns in the current environment.
Equity earnings yield less 10-year treasury yield
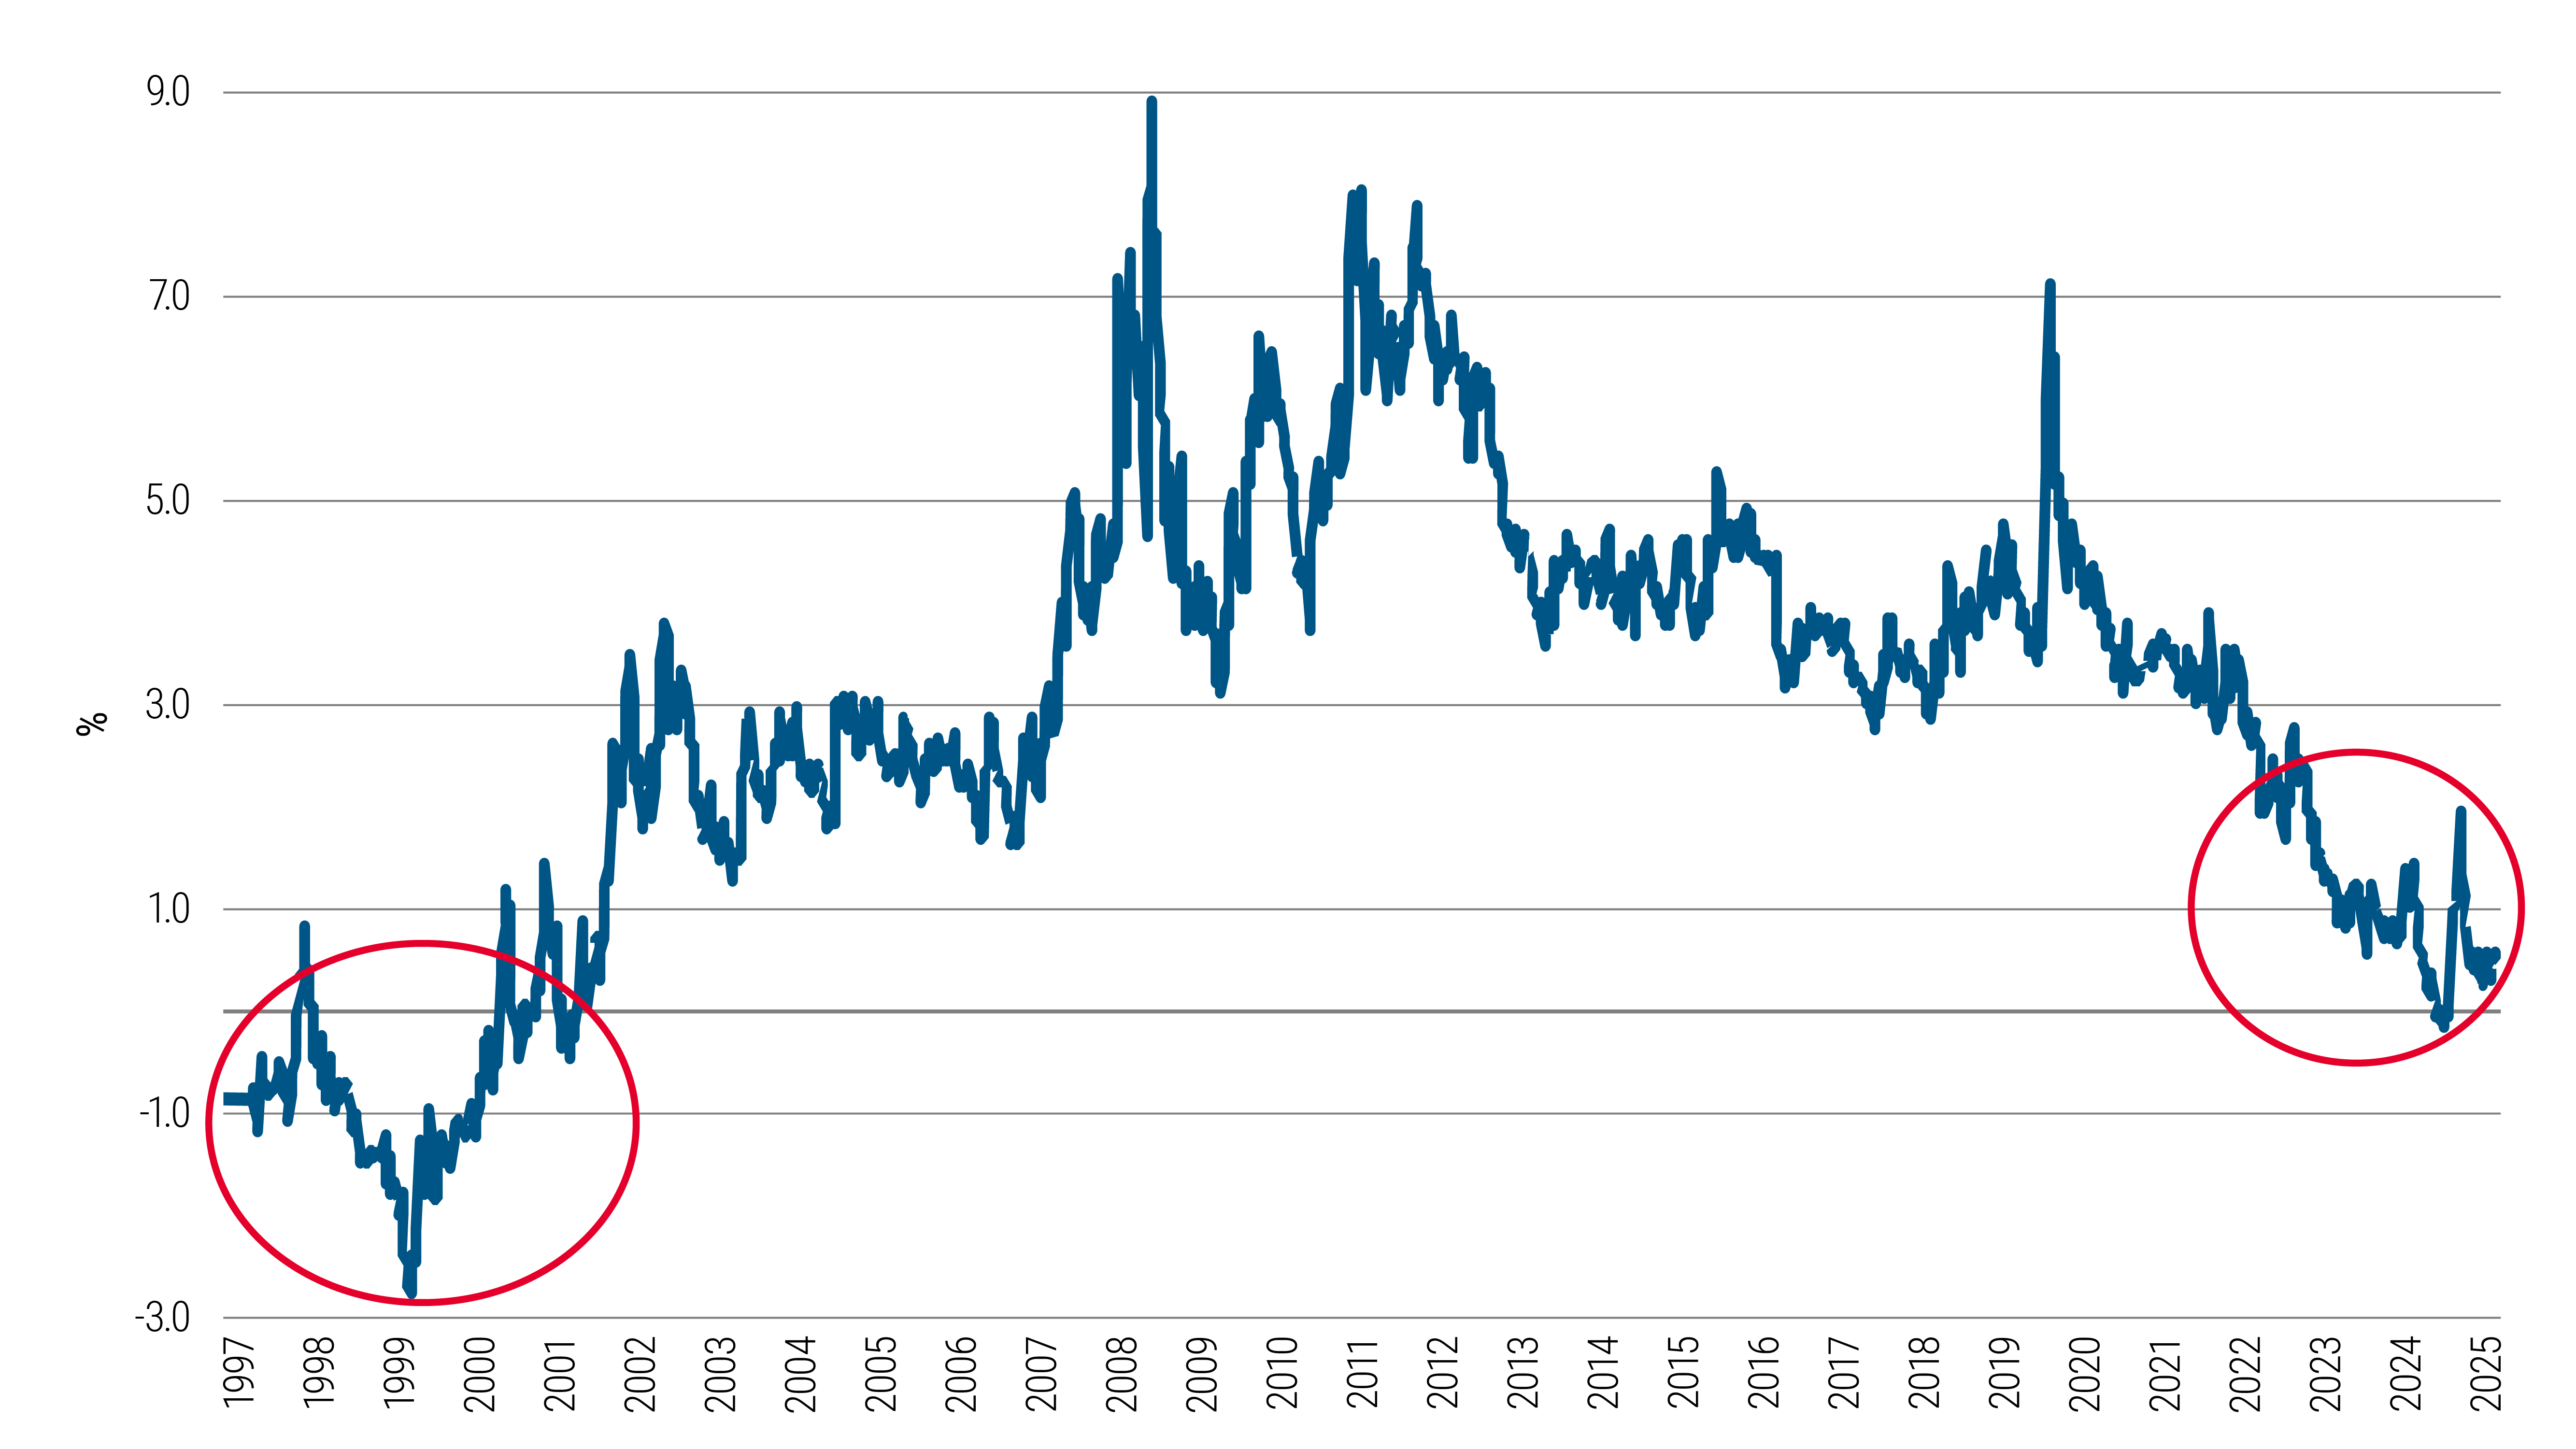
Source: Bloomberg data and PIMCO calculations as of August 2025. Equity earnings yield is 1-year forward earnings divided by the price of the SPX index. Past performance is not a guarantee or a reliable indicator of future results.
Market pricing reflects expectations for long-term uncertainty
But while stock markets appear optimistic and inflation expectations seem stable for now, higher policy uncertainty has kept yields on 10-year Treasuries elevated.
The difference between 10-year U.S. Treasury yields and the nominal neutral rate has risen above the levels signaled in Fed communications. This gap suggests the market is pricing in more risk for the long term.
This could put upward pressure on long-term interest rates. It also signals elevated uncertainty about future inflation and growth.
Fedspeak vs. the gap between 10-year U.S. Treasuries and the neutral rate
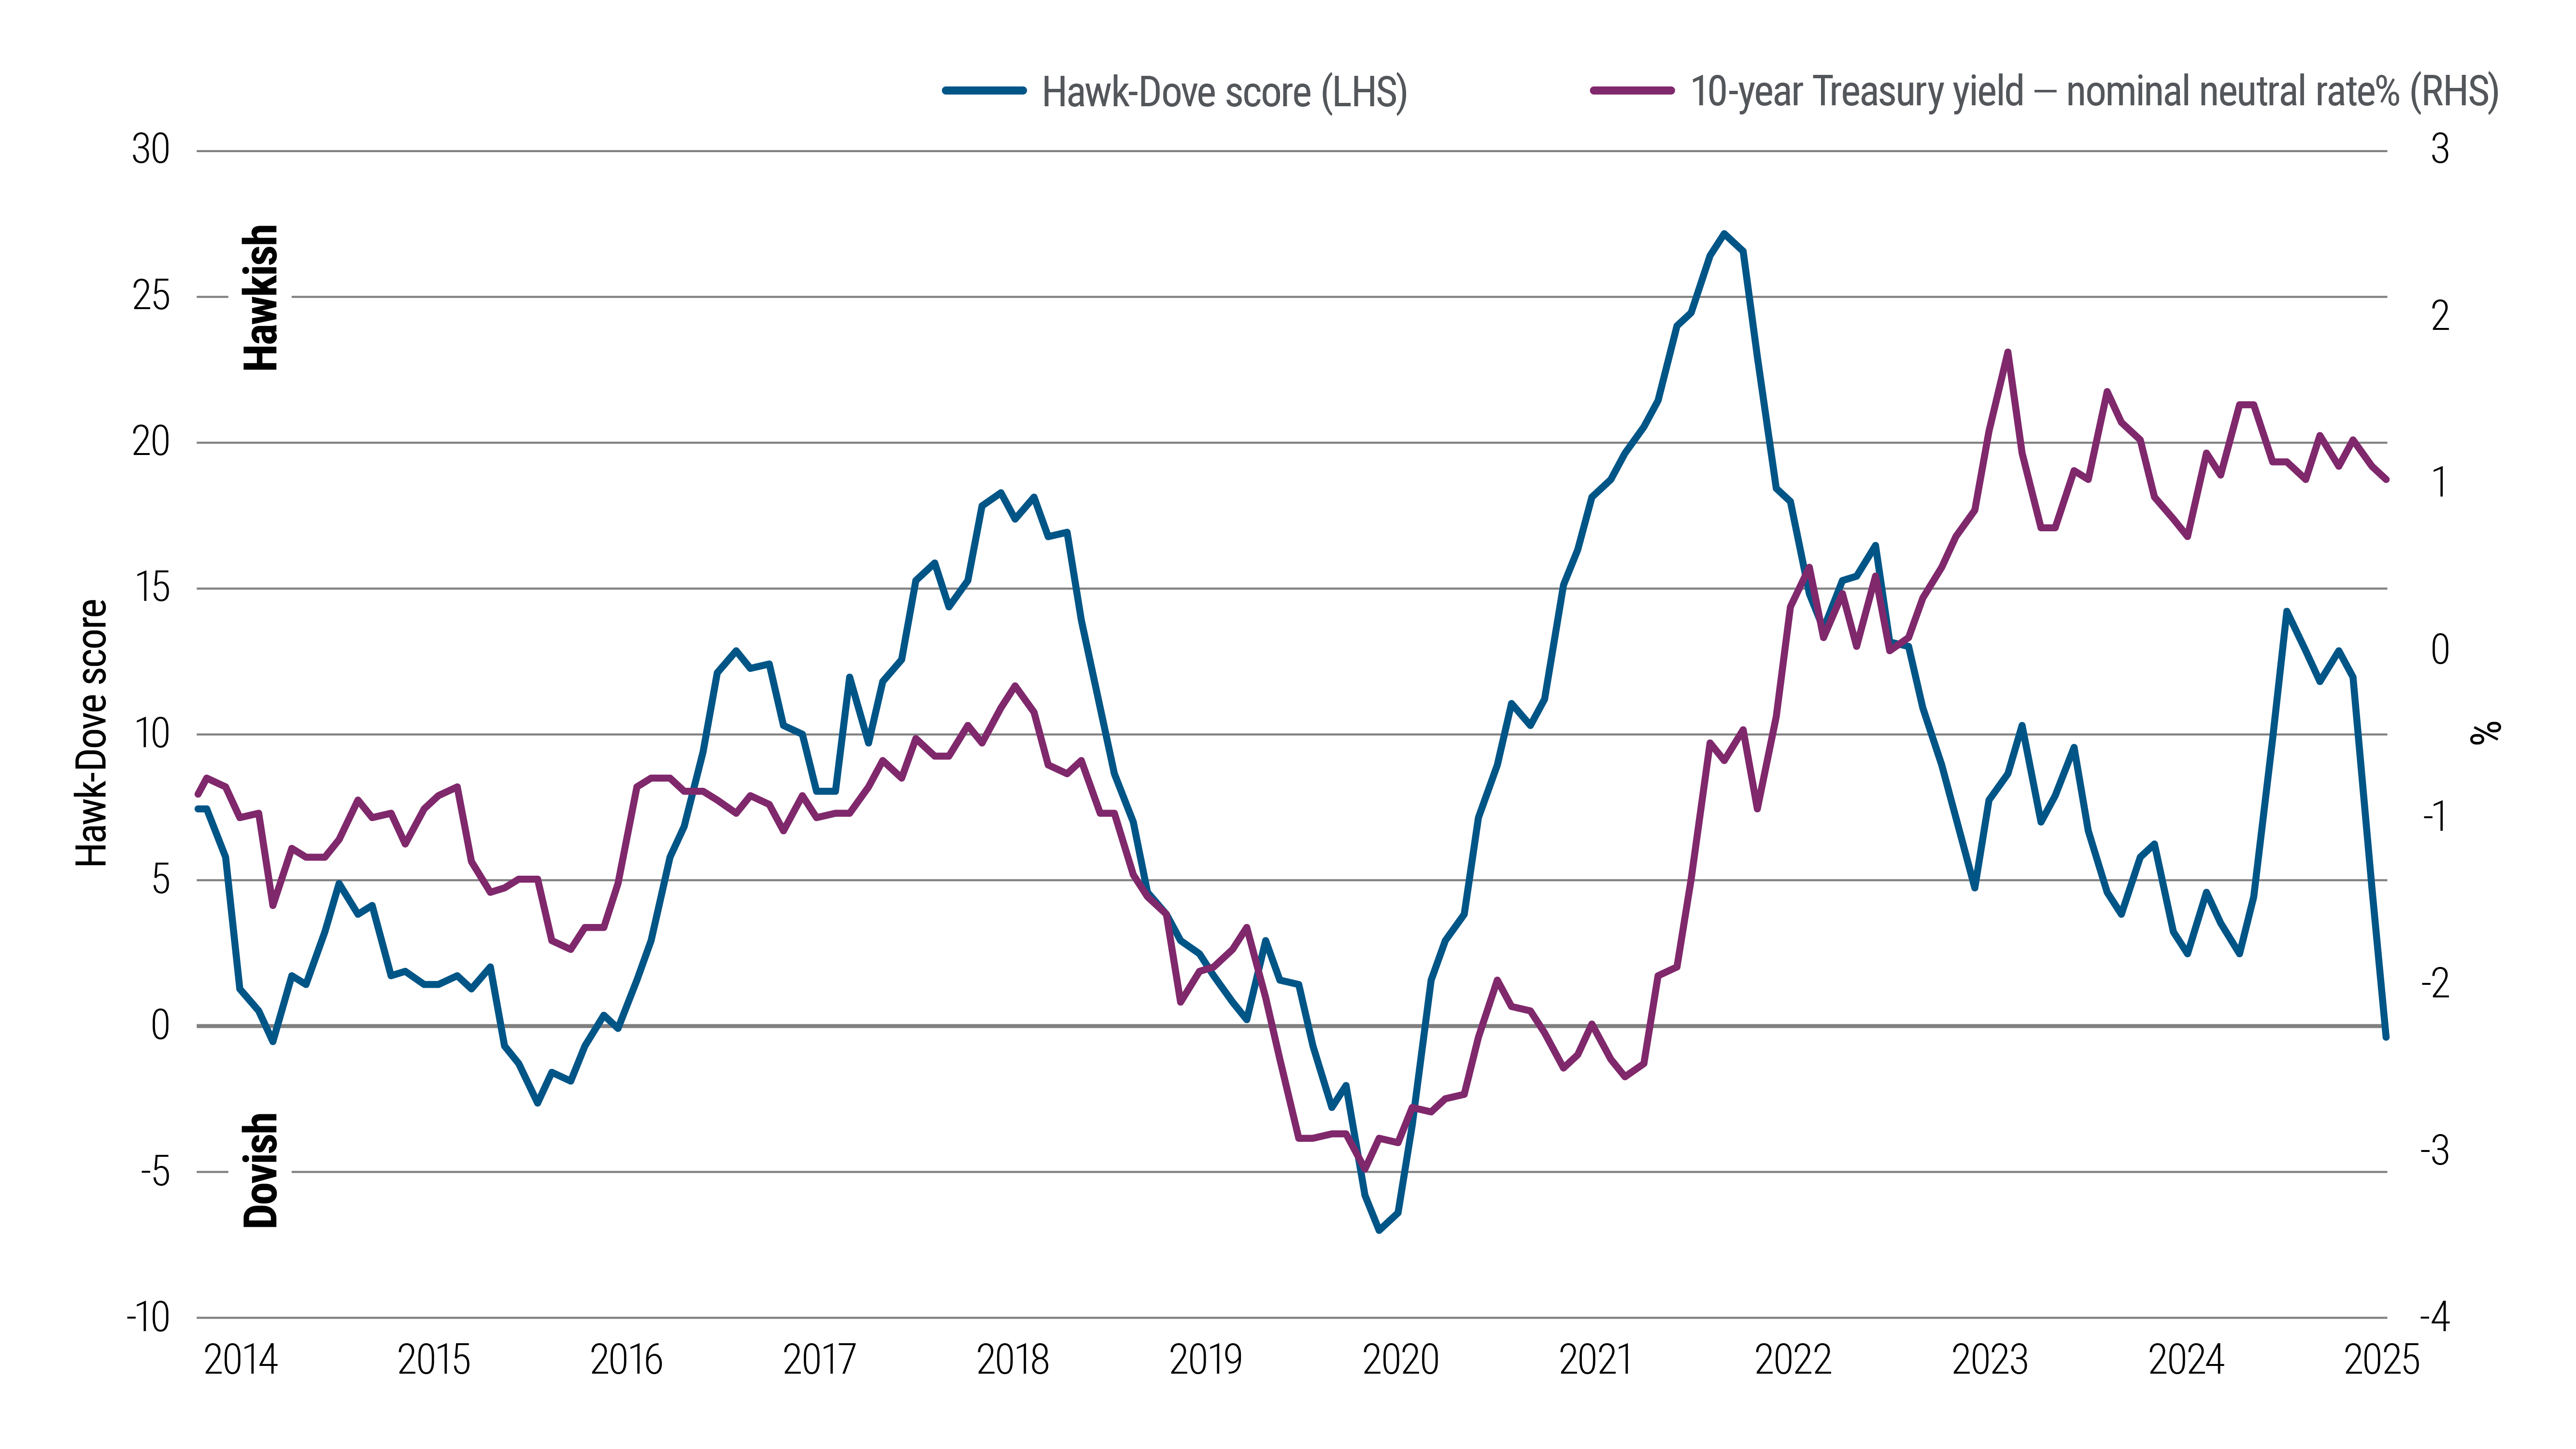
Source: Bloomberg data and PIMCO calculations as of August 2025. The Hawk-Dove score assesses central bank communications to estimate monetary policy tendencies. The nominal neutral rate (often called r* or r-star) is an estimate of an interest rate that neither stimulates nor hinders economic growth. The nominal rate is calculated using the Laubach Williams measure. Past performance is not a guarantee or a reliable indicator of future results.
A long-term trend has reasserted itself: Benchmark US bond index yield exceeds the Fed policy rate
In late 2024, the Bloomberg US Aggregate Bond Index yield rose above the Fed’s policy rate for the first time in more than a year and has stayed there – emphasizing the compelling starting point for bonds now.
It was extraordinary to have a benchmark bond yield running below – sometimes well below – the policy rate. Prior to the pandemic, this had happened only four times in this century.
Fixed income offers an attractive opportunity with high starting yields. Historically, bonds have performed well across a range of different rate-cutting scenarios, and downward moves in bond yields have tended to follow cuts in the Fed policy rate.
Yield-to-worst on the Bloomberg US Aggregate Bond Index versus the fed funds rate
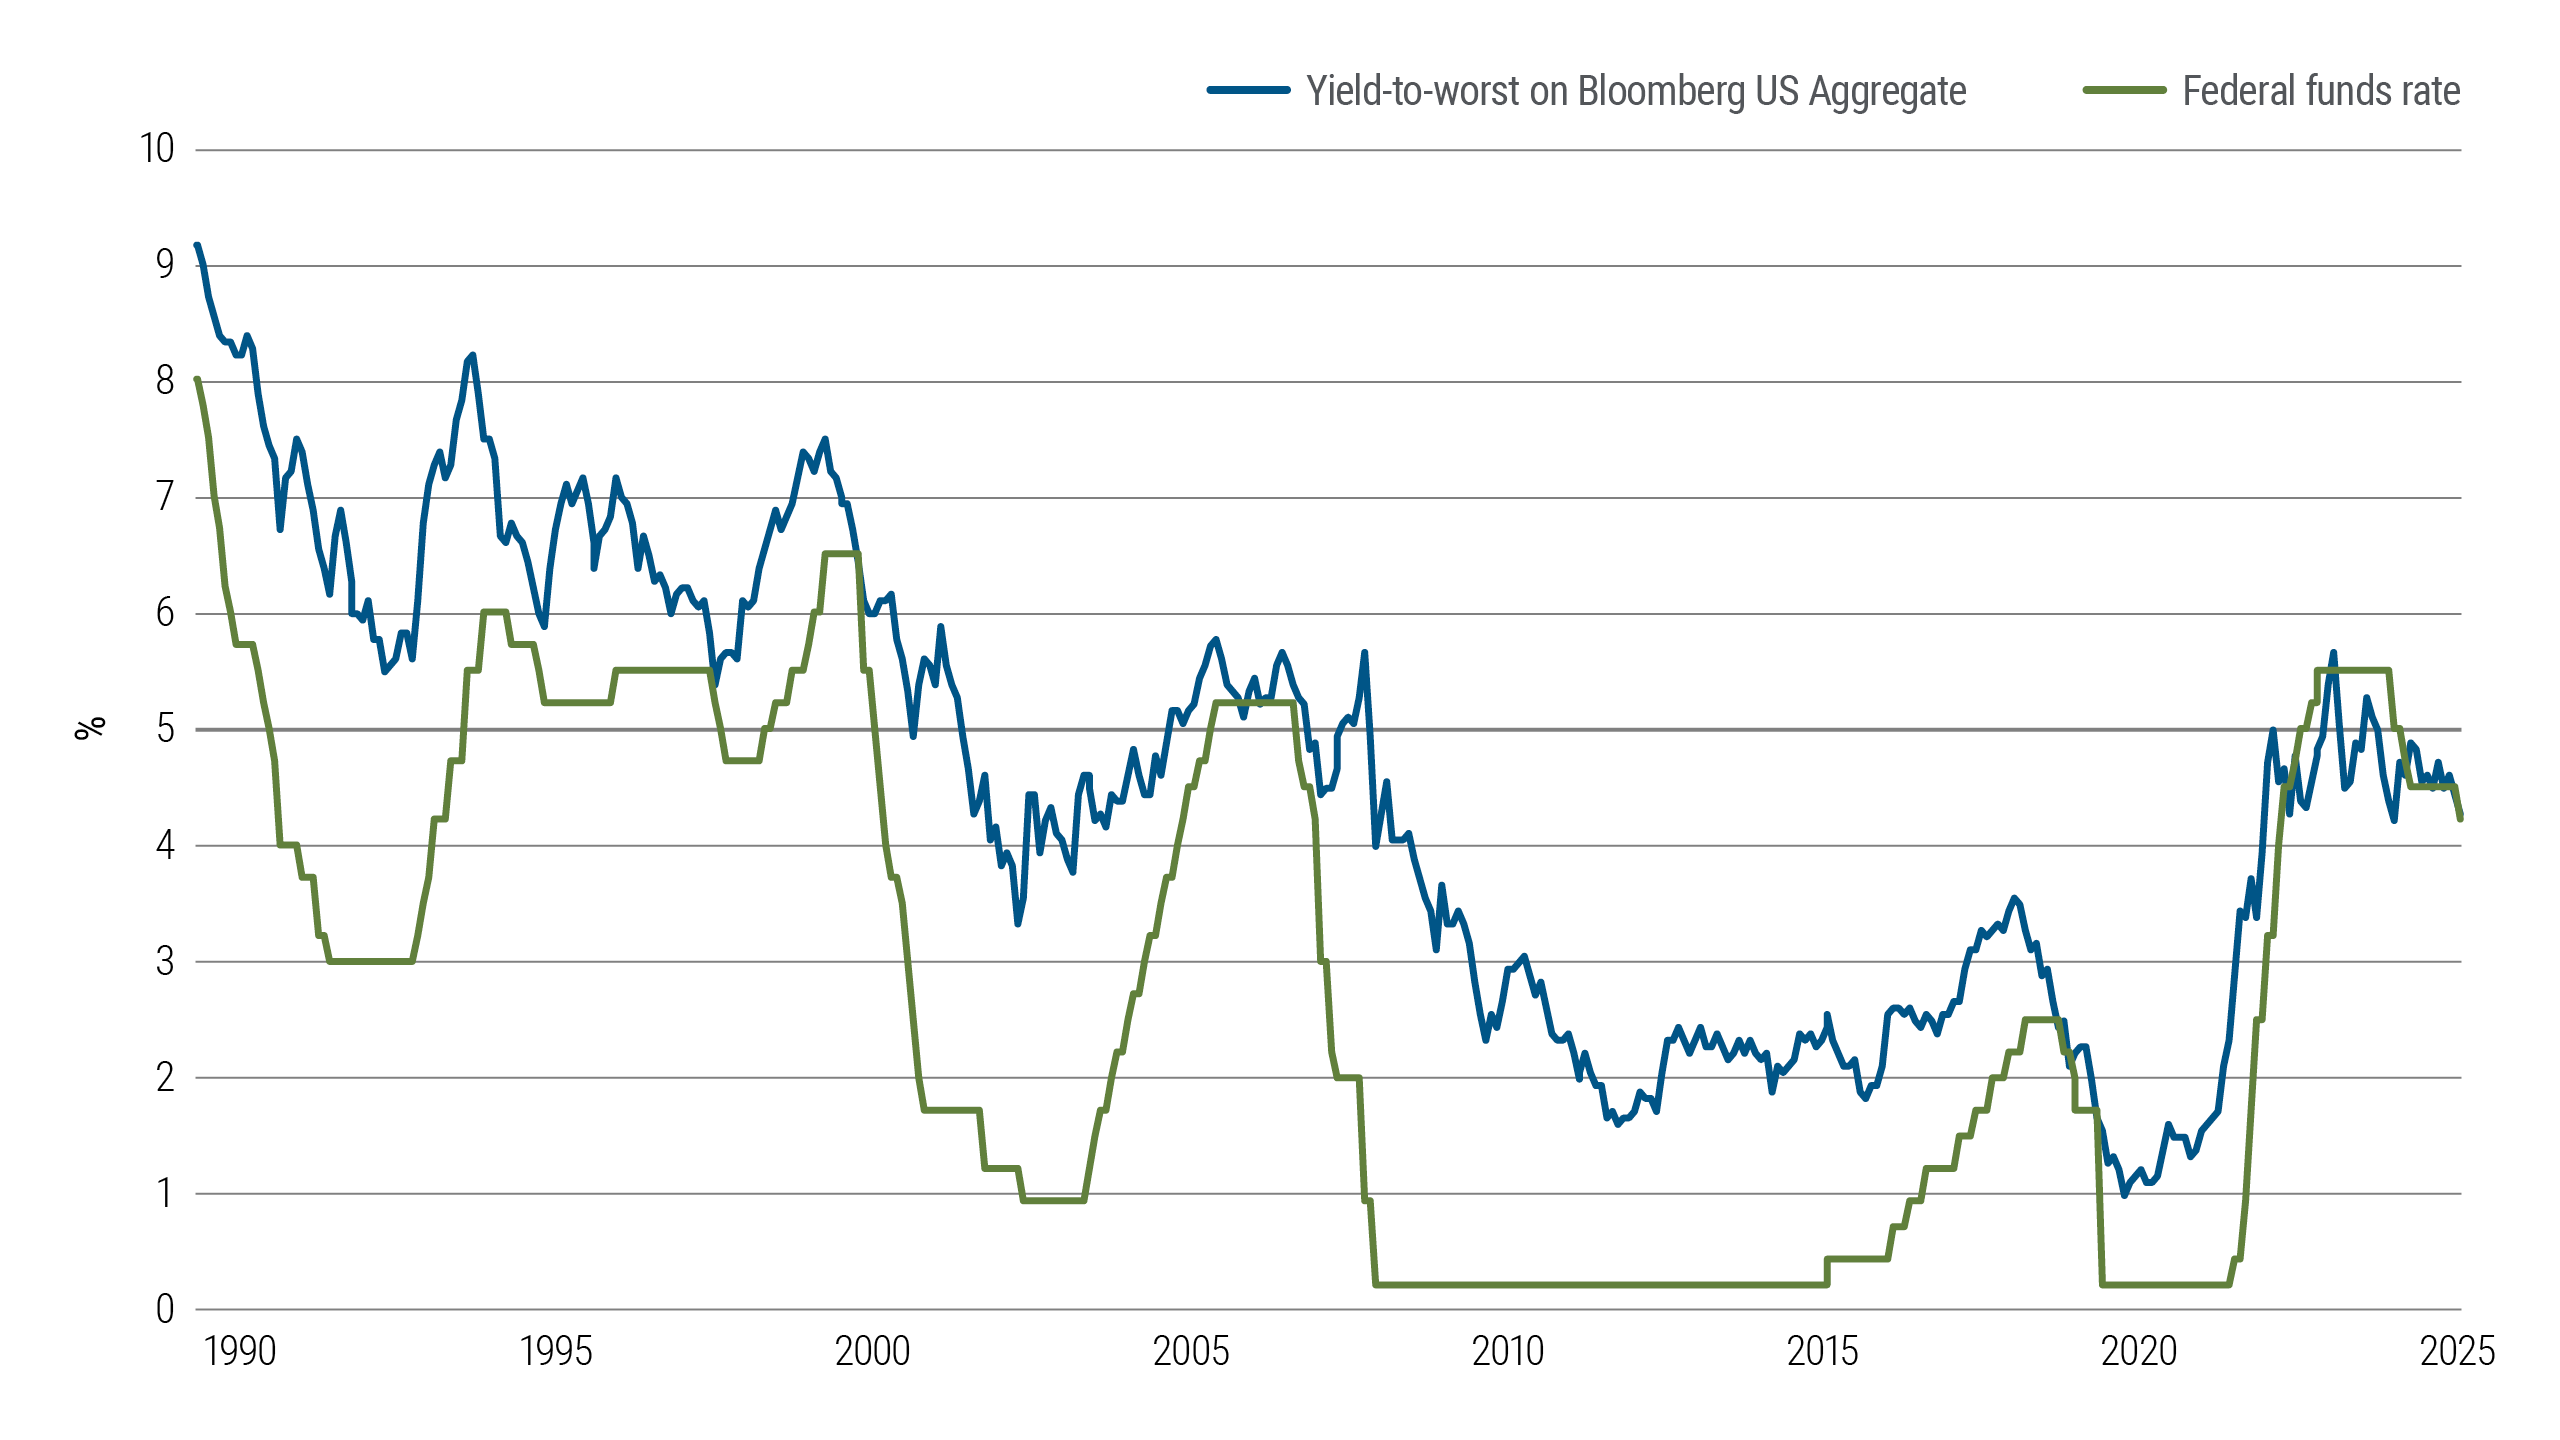
Source: U.S. Federal Reserve and Bloomberg as of September 2025. Yield-to-worst is the estimated lowest potential yield that can be received on a bond without the issuer actually defaulting. Past performance is not a guarantee or a reliable indicator of future results.
Market signals in German and U.S. inflation-linked bonds
Looking beyond the U.S., another long-term trend has returned during the post-pandemic recovery period: The yield on German 10-year inflation-indexed Bunds (or “linkers”) has remained in positive territory for nearly two years, after more than a decade below zero.
Linker yields still significantly lag the inflation-indexed yield on U.S. Treasury Inflation-Protected Securities (TIPS). TIPS yields have been hovering around 2% since 2023, but previously had been lower – even negative – in the low-inflation environment that followed the global financial crisis.
Higher inflation-indexed yields are another signal that fixed income may be an attractive, risk-aware investment in today’s uncertain macroeconomic environment.
Inflation-indexed yields on 10-year U.S. Treasuries and German Bunds

Source: Bloomberg data and PIMCO calculations as of August 2025. Past performance is not a guarantee or a reliable indicator of future results.

