
Rising home equity has fueled U.S. consumer strength
U.S. consumers have benefited from a steady increase in homeowner equity over the past several decades, which has been a key driver of rising household net worth. As of late 2024, the median net worth of U.S. homeowners is approximately $400,000, while that of renters is about $10,400 – a nearly 40-fold difference in household wealth.1
The growth in homeowners’ net worth is supported by record-high home values, low long-term debt costs (many households secured low fixed-rate mortgages during 2020–2021), and elevated savings and cash reserves.
Combined with a strong labor market and wage growth, these factors contribute to a resilient U.S. consumer base that is well-positioned to navigate economic challenges and tighter lending conditions.
Increasing homeowner equity
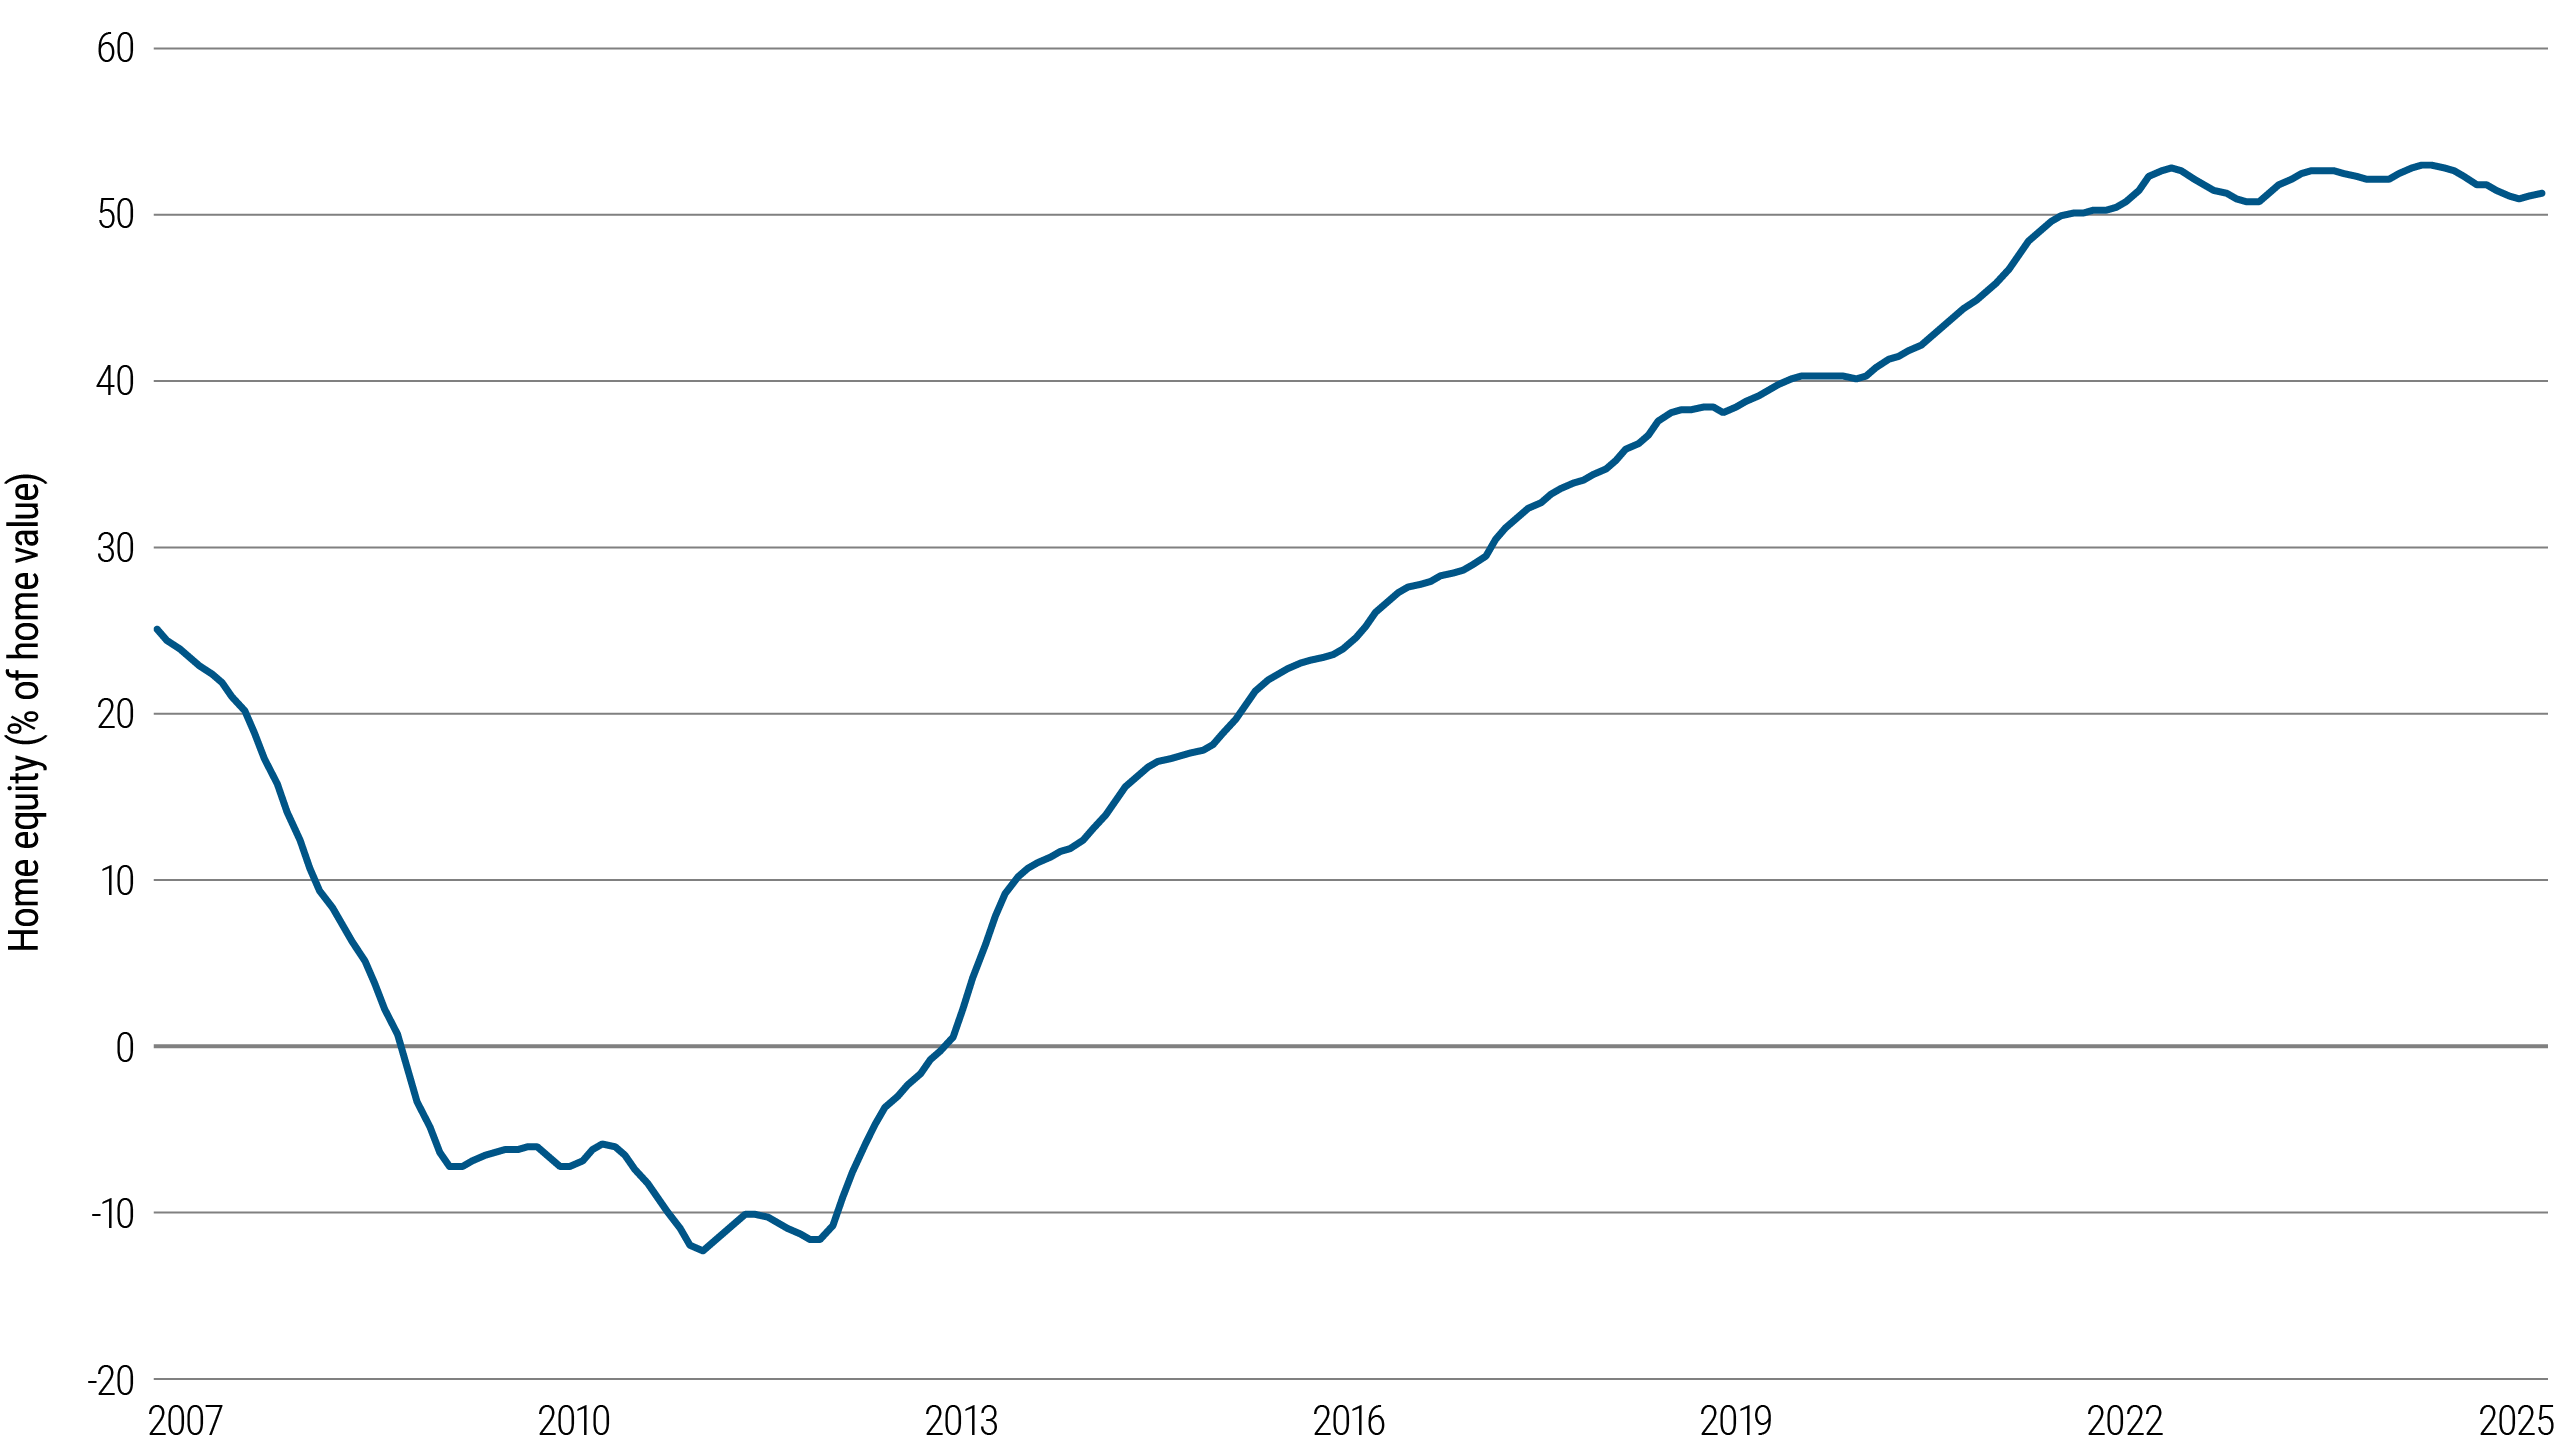
Source: PIMCO as of 20 May 2025. This chart shows the combined loan-to-value ratio, which is the ratio of all loans secured by a property to the property’s value.
1 According to the Aspen Institute
Active underwriting reveals risks concealed by inflated credit scores
However, while U.S. household balance sheets remain broadly healthy, delinquencies are rising. During the pandemic, widespread fiscal stimulus, loan forbearance, and suppression of delinquent collections led to an artificial boost in credit scores, a phenomenon we call “FICO inflation.”
Average FICO scores surged, peaking around 715 in 2021. Today, some of these borrowers are delinquent or even defaulting: As the pandemic-related supports rolled off, credit performance normalized, exposing vulnerabilities among borrowers whose scores were temporarily elevated.
PIMCO Equifax panel average vantage score
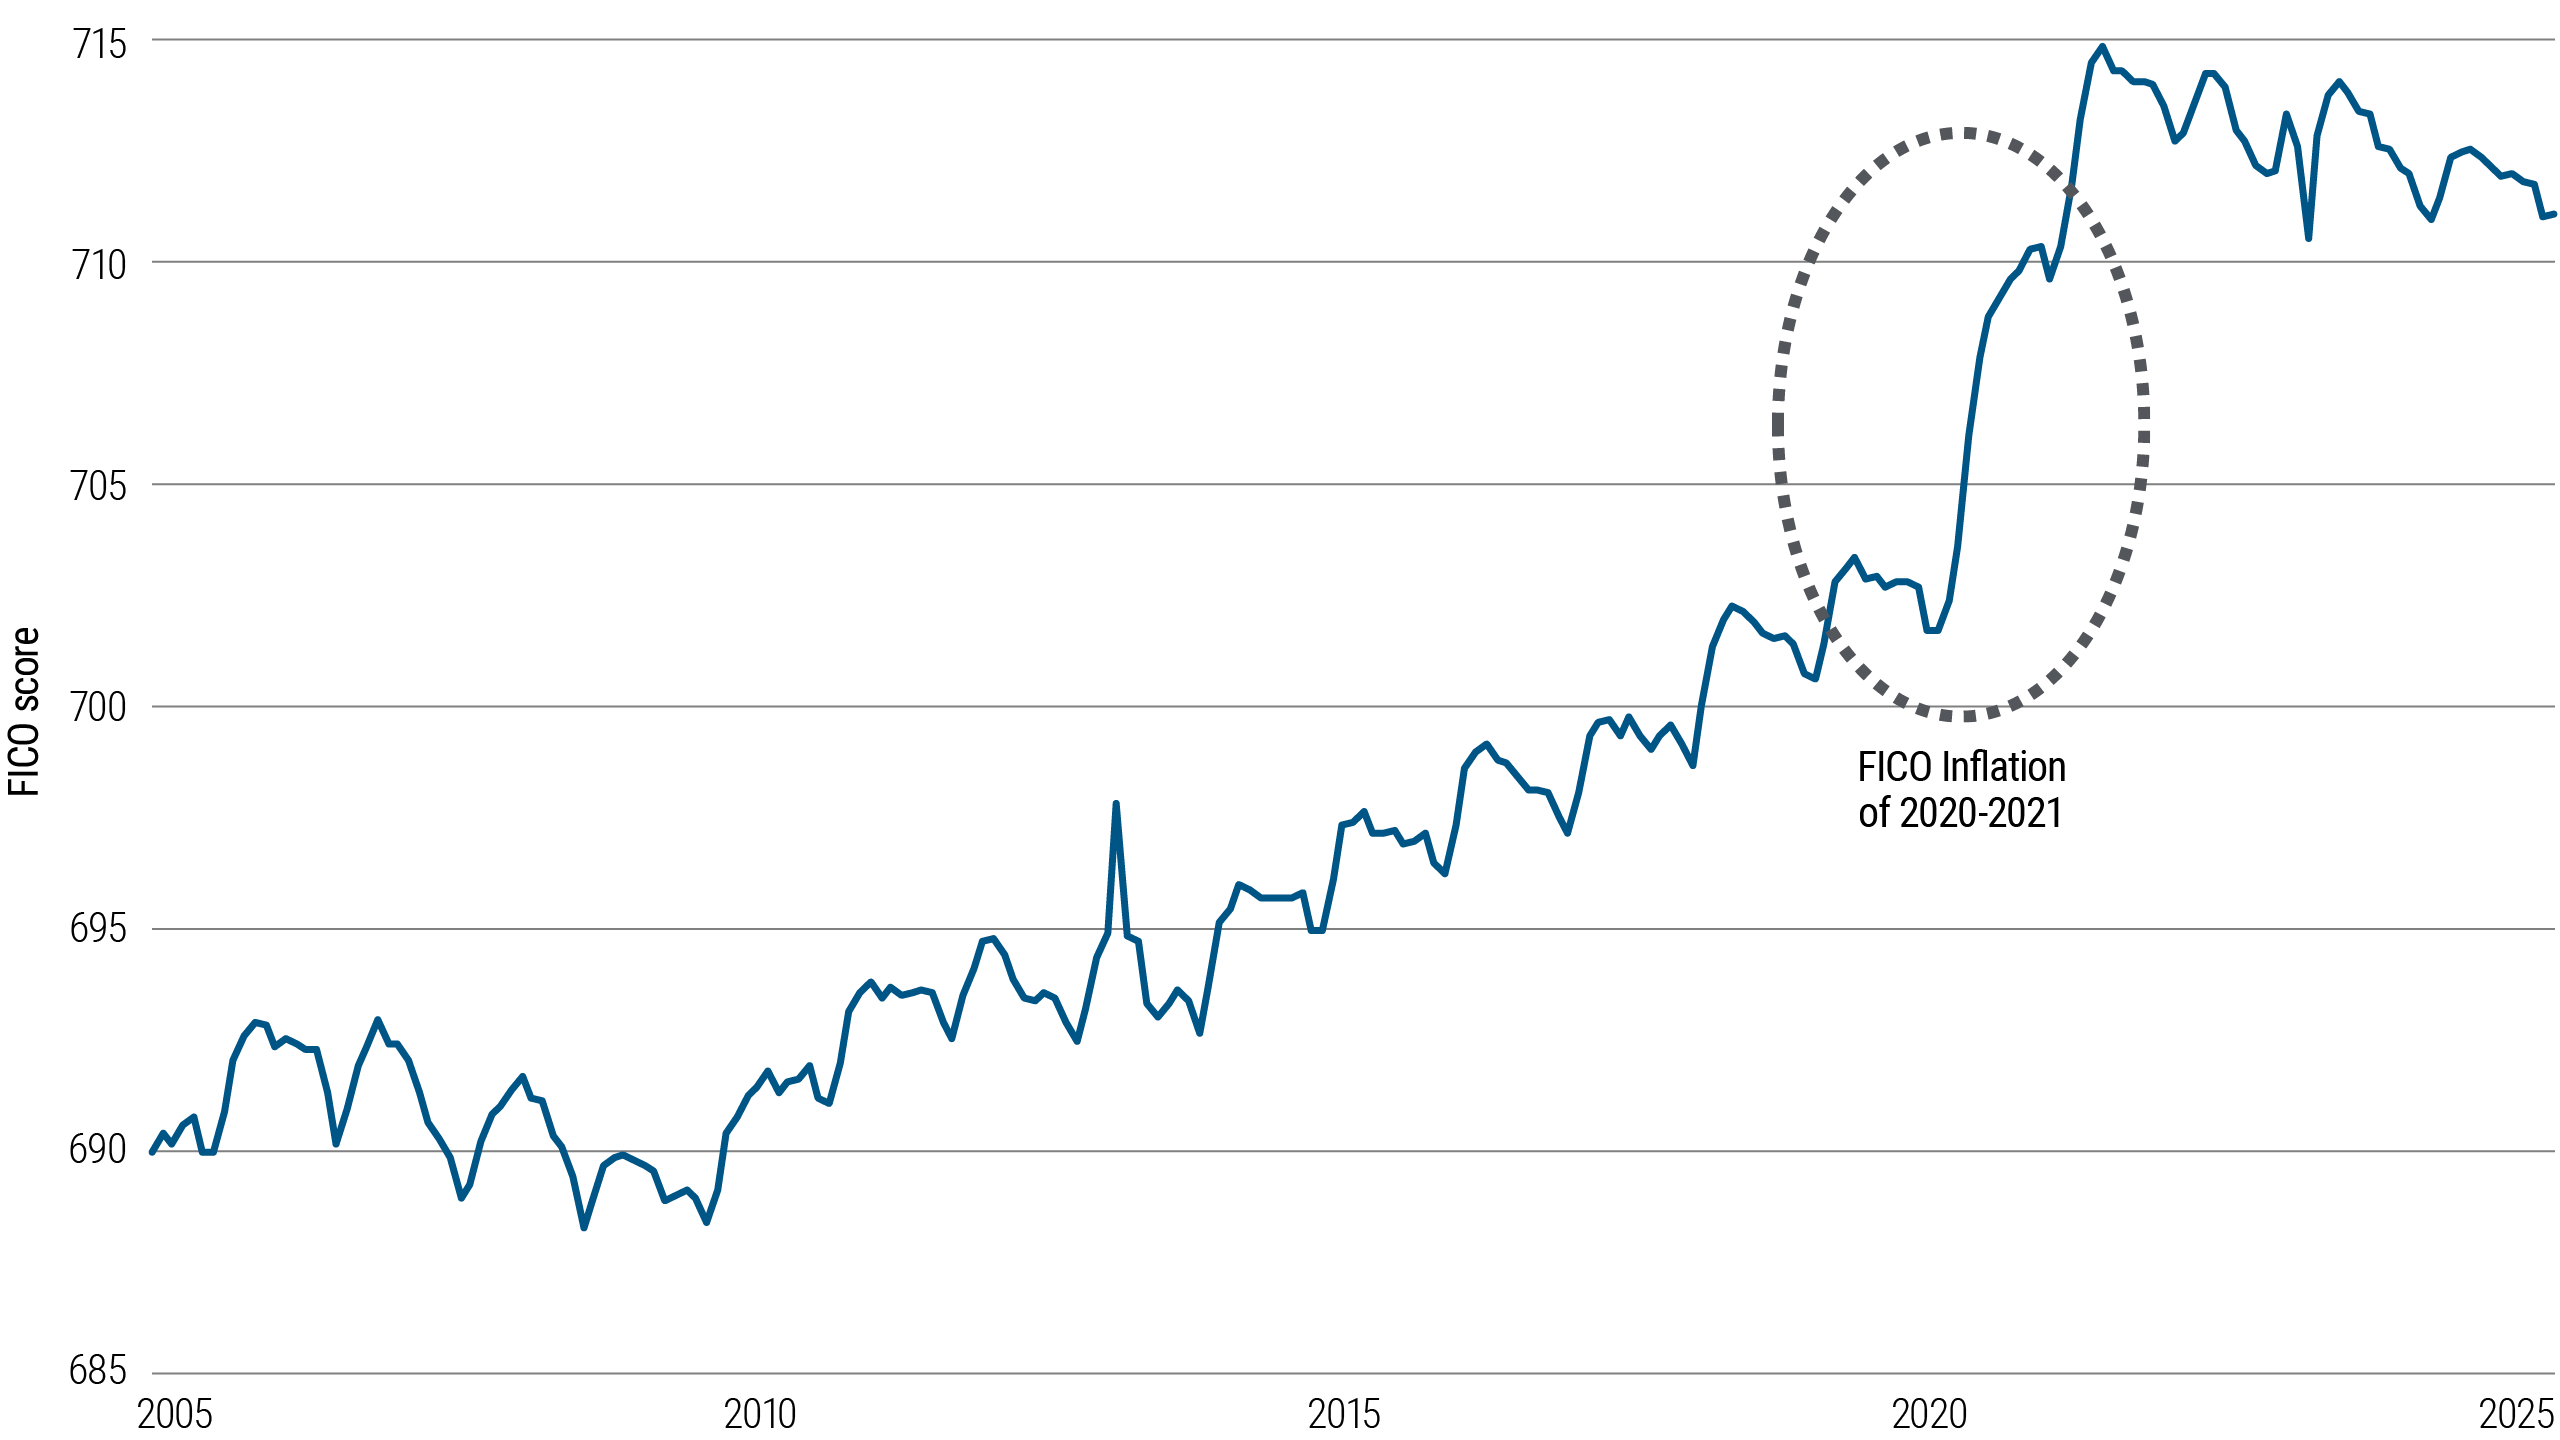
Source: Equifax data and PIMCO calculations as of 20 May 2025
Lower-tier borrowers showed greater FICO inflation, with higher-tier borrowers relatively unaffected
In particular, lower-tier (601–650) and mid-tier (661–720) credit bands saw the biggest lift, with FICO scores jumping 25–30 points and 20–25 points, respectively.
By contrast, top-tier borrowers (781–850) saw little to no impact. Recalibrations to the score-calculating model may have amplified the net effect.
Overall, FICO inflation appears to have given a disproportionate – and in many cases temporary – benefit to riskier borrowers.
Average credit score impact across credit buckets
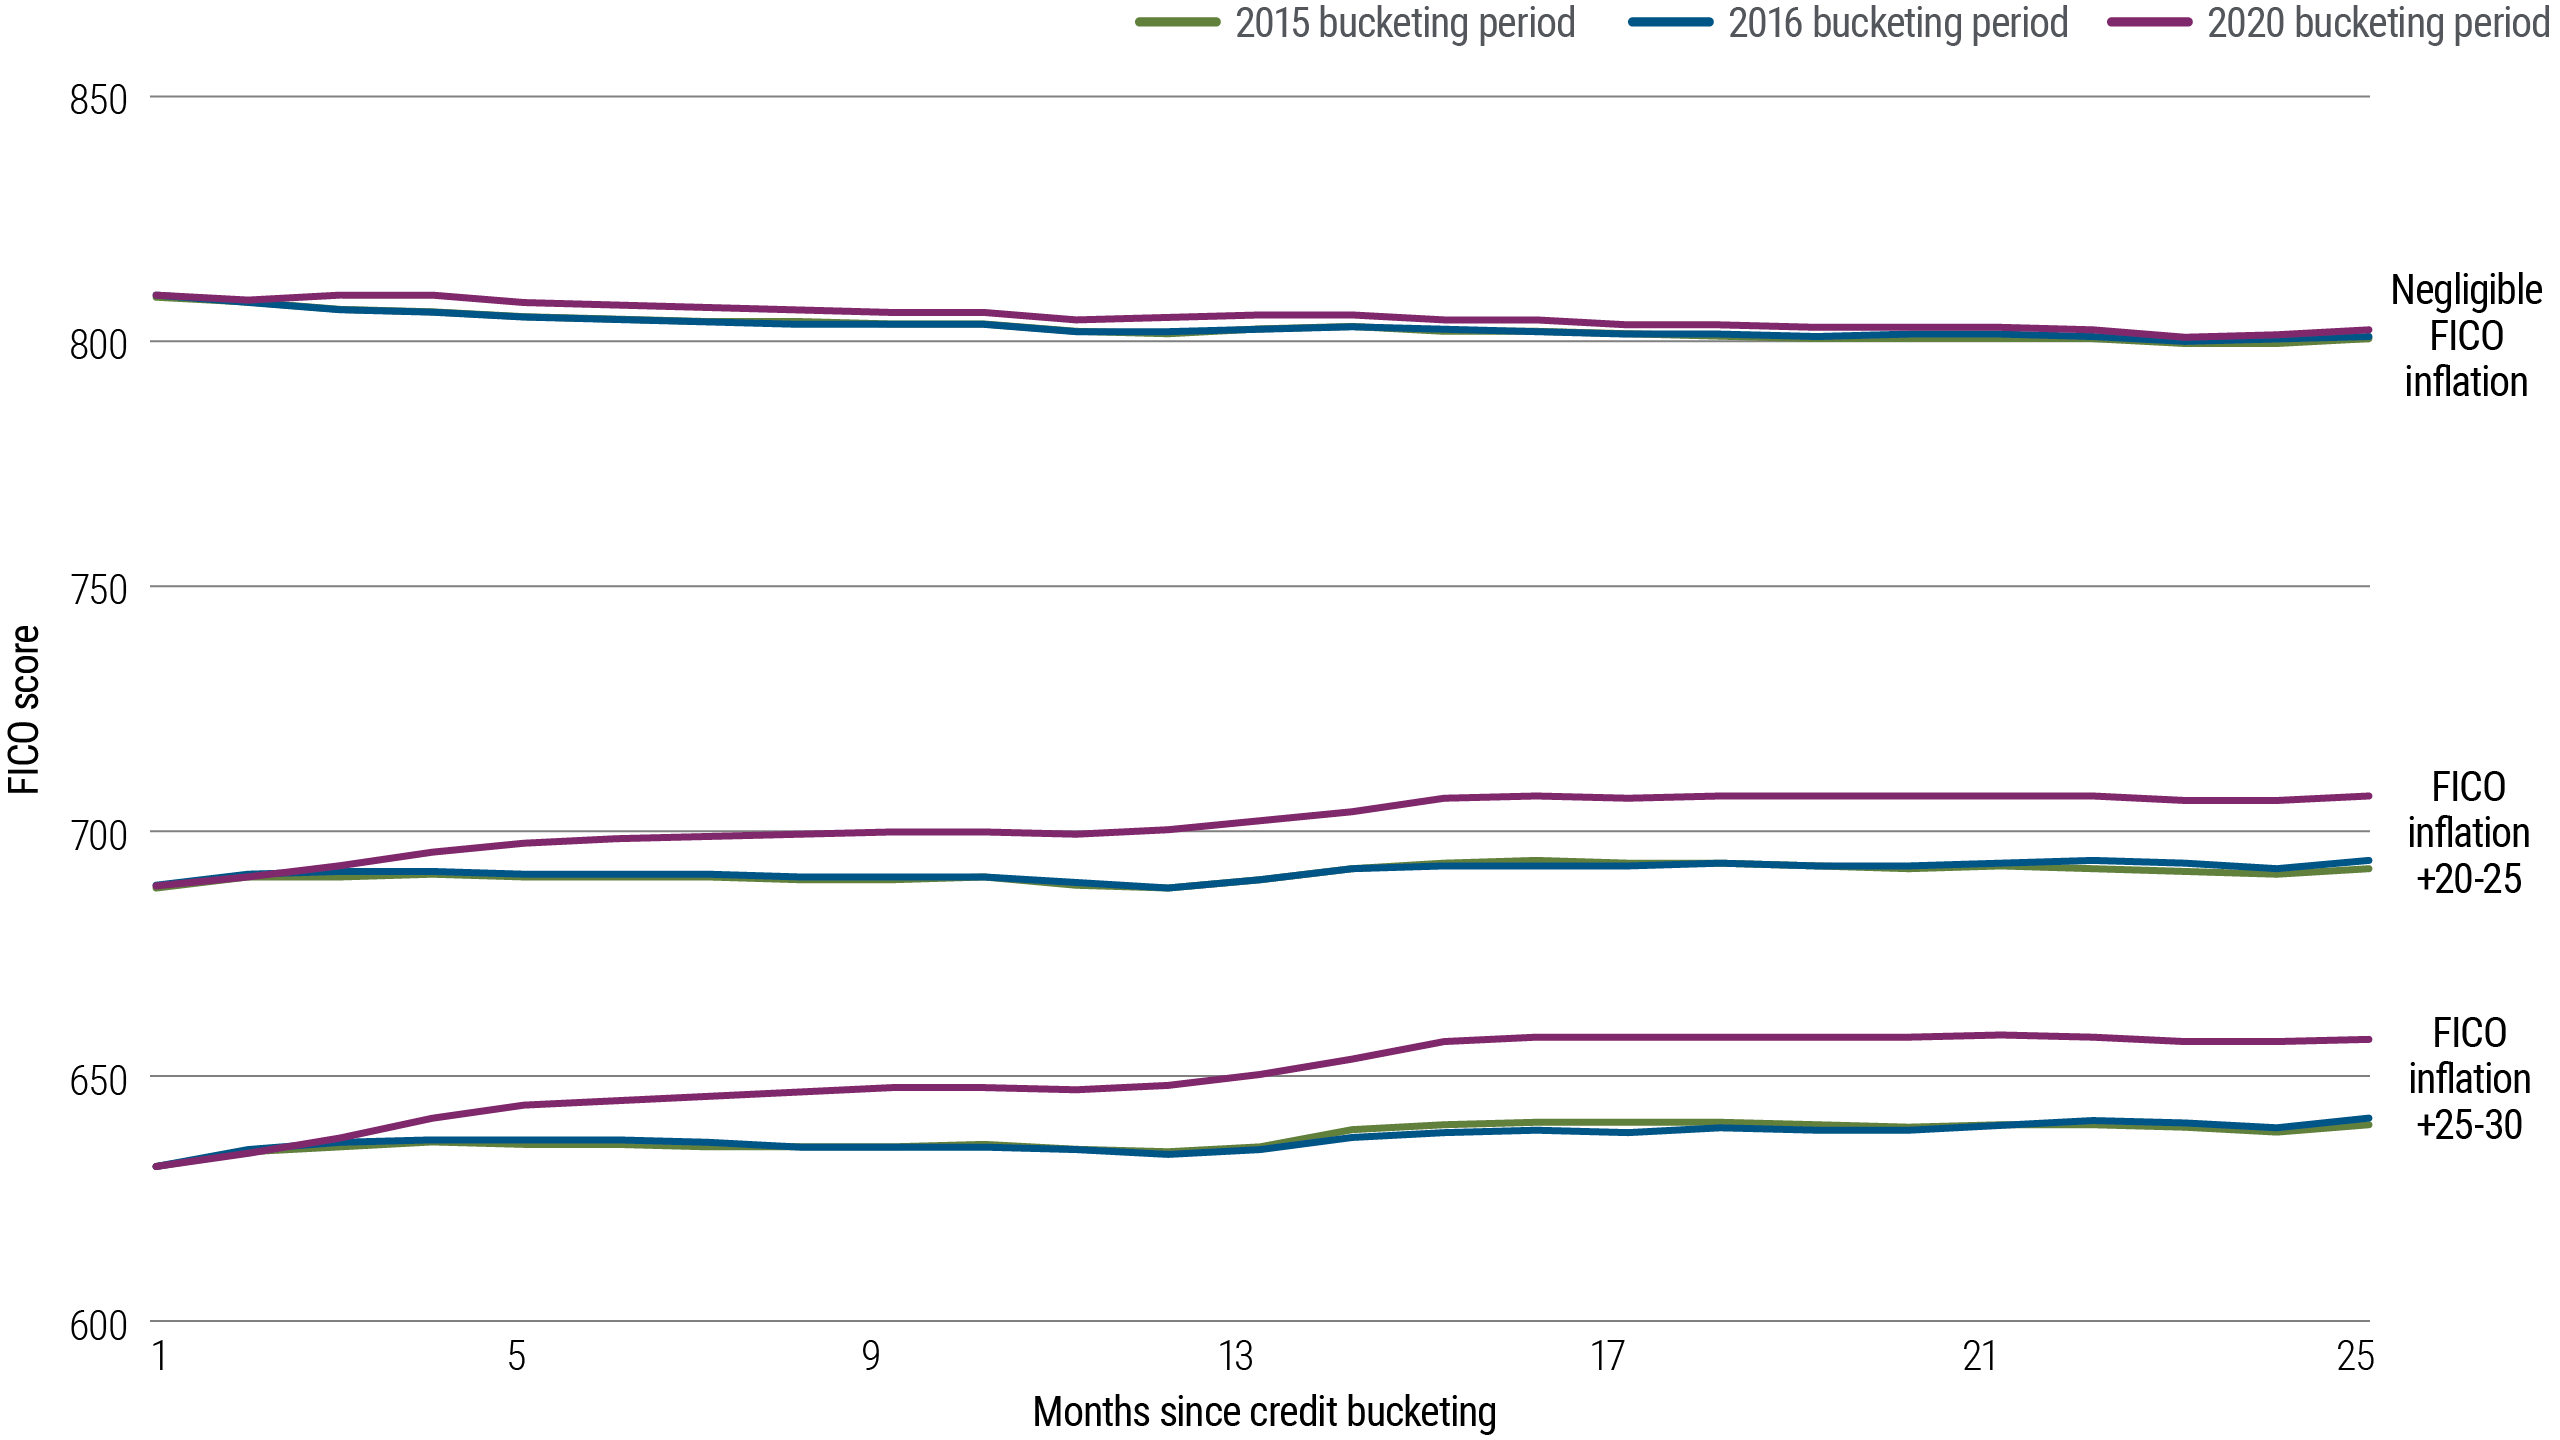
Source: Equifax data and PIMCO calculations as of May 2025
Lending connected to resilient U.S. homeowners is increasingly attractive in a divergent market
Delinquencies are increasingly bifurcated by consumer asset class.
Some borrowers are faring well: As of Q4 2024, serious delinquencies (90+ days) in mortgages, home equity line of credit, and student loans remain near historical lows, supported by home equity gains, fixed-rate debt structures, and policy tailwinds.
In contrast, credit cards and auto loans – particularly among lower-tier borrowers – have seen a steady rise in delinquencies since 2022, reflecting inflation pressures and depleted pandemic-era savings. Student loans may come under greater pressure in the months ahead as pandemic-related forbearance programs end.
Thoughtful analysis of consumer loan pools is critical to managing the risk/reward balance in asset-based finance.
Delinquencies across consumer loan types
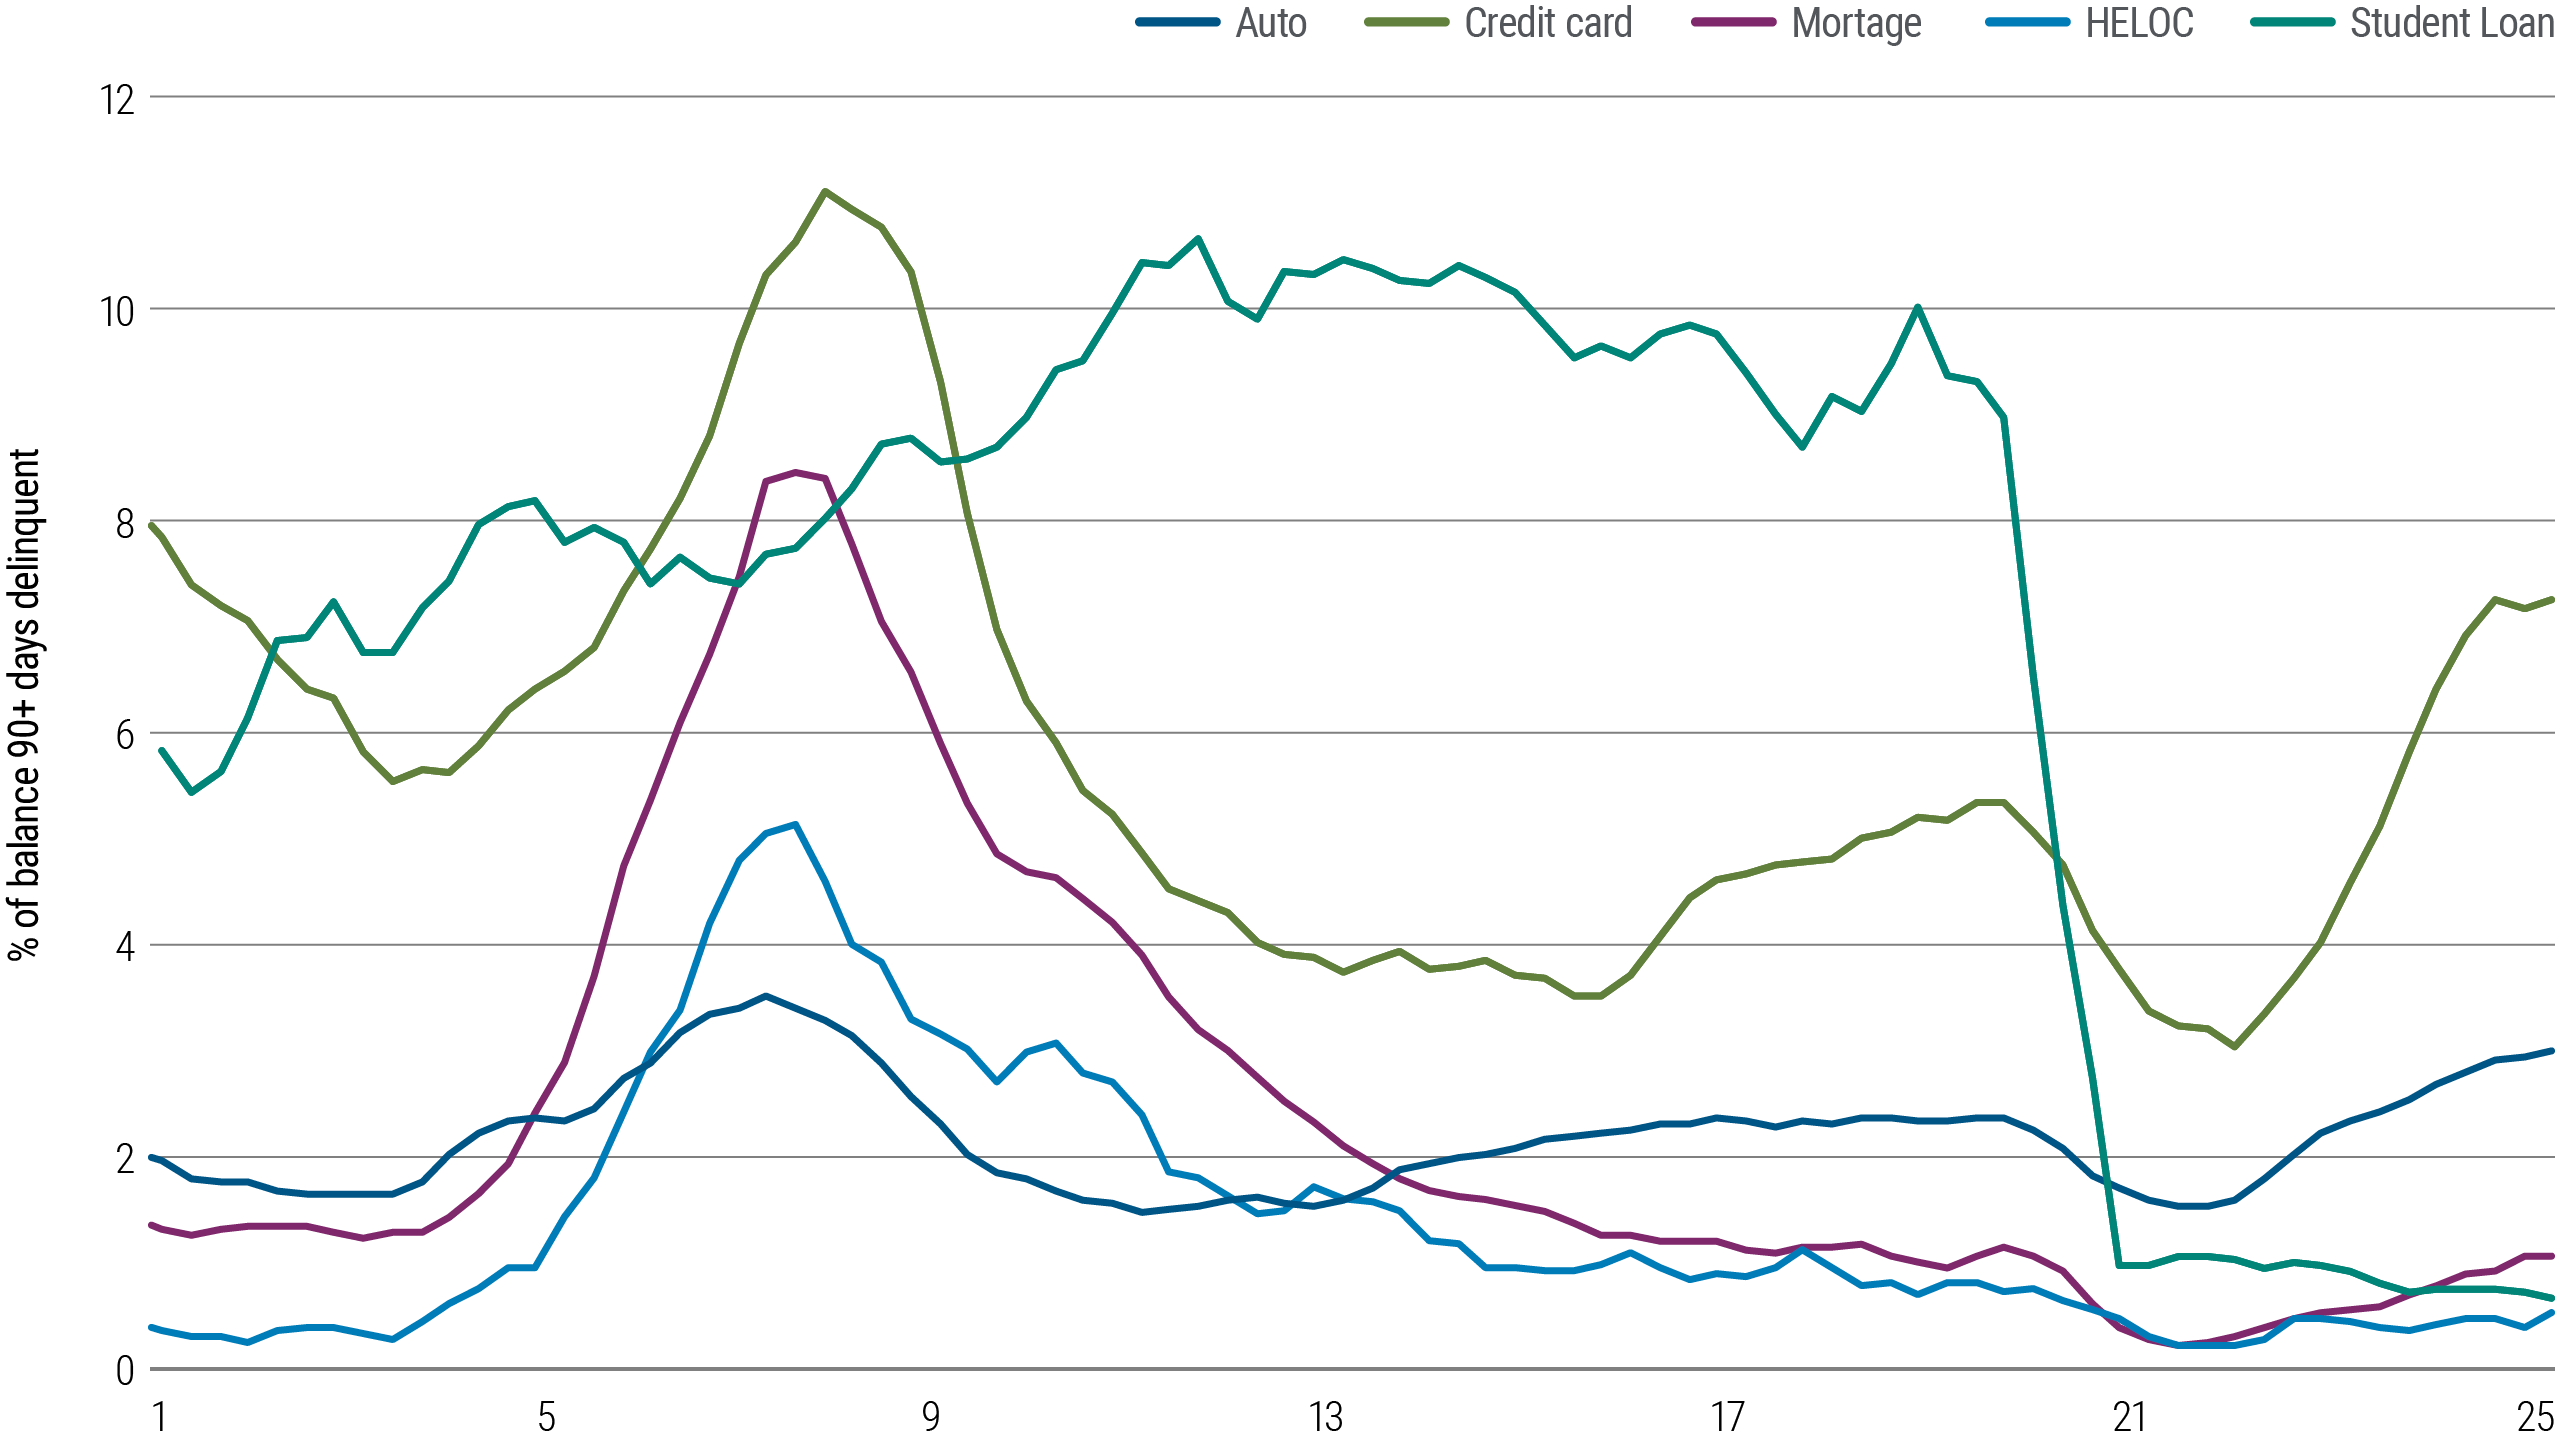
Source: Federal Reserve Bank of New York as of 14 May 2025
Tighter underwriting standards bolster resilience in consumer lending
Facing these delinquency trends, personal loan originators have become more cautious in 2024 and 2025, underwriting to some of the tightest credit standards in recent history. Average FICO scores on new originations now approach 730, up from below 700 just three years ago, while borrower income has climbed to $140,000 on average – more than a 25% increase since 2022.
These shifts reflect careful credit analysis and a focus on more reliable borrowers in what’s likely the later stage of the credit cycle.
The result of stricter underwriting standards is a more defensive and resilient personal loan market, with structural tailwinds for performance.
Originations by income and by FICO
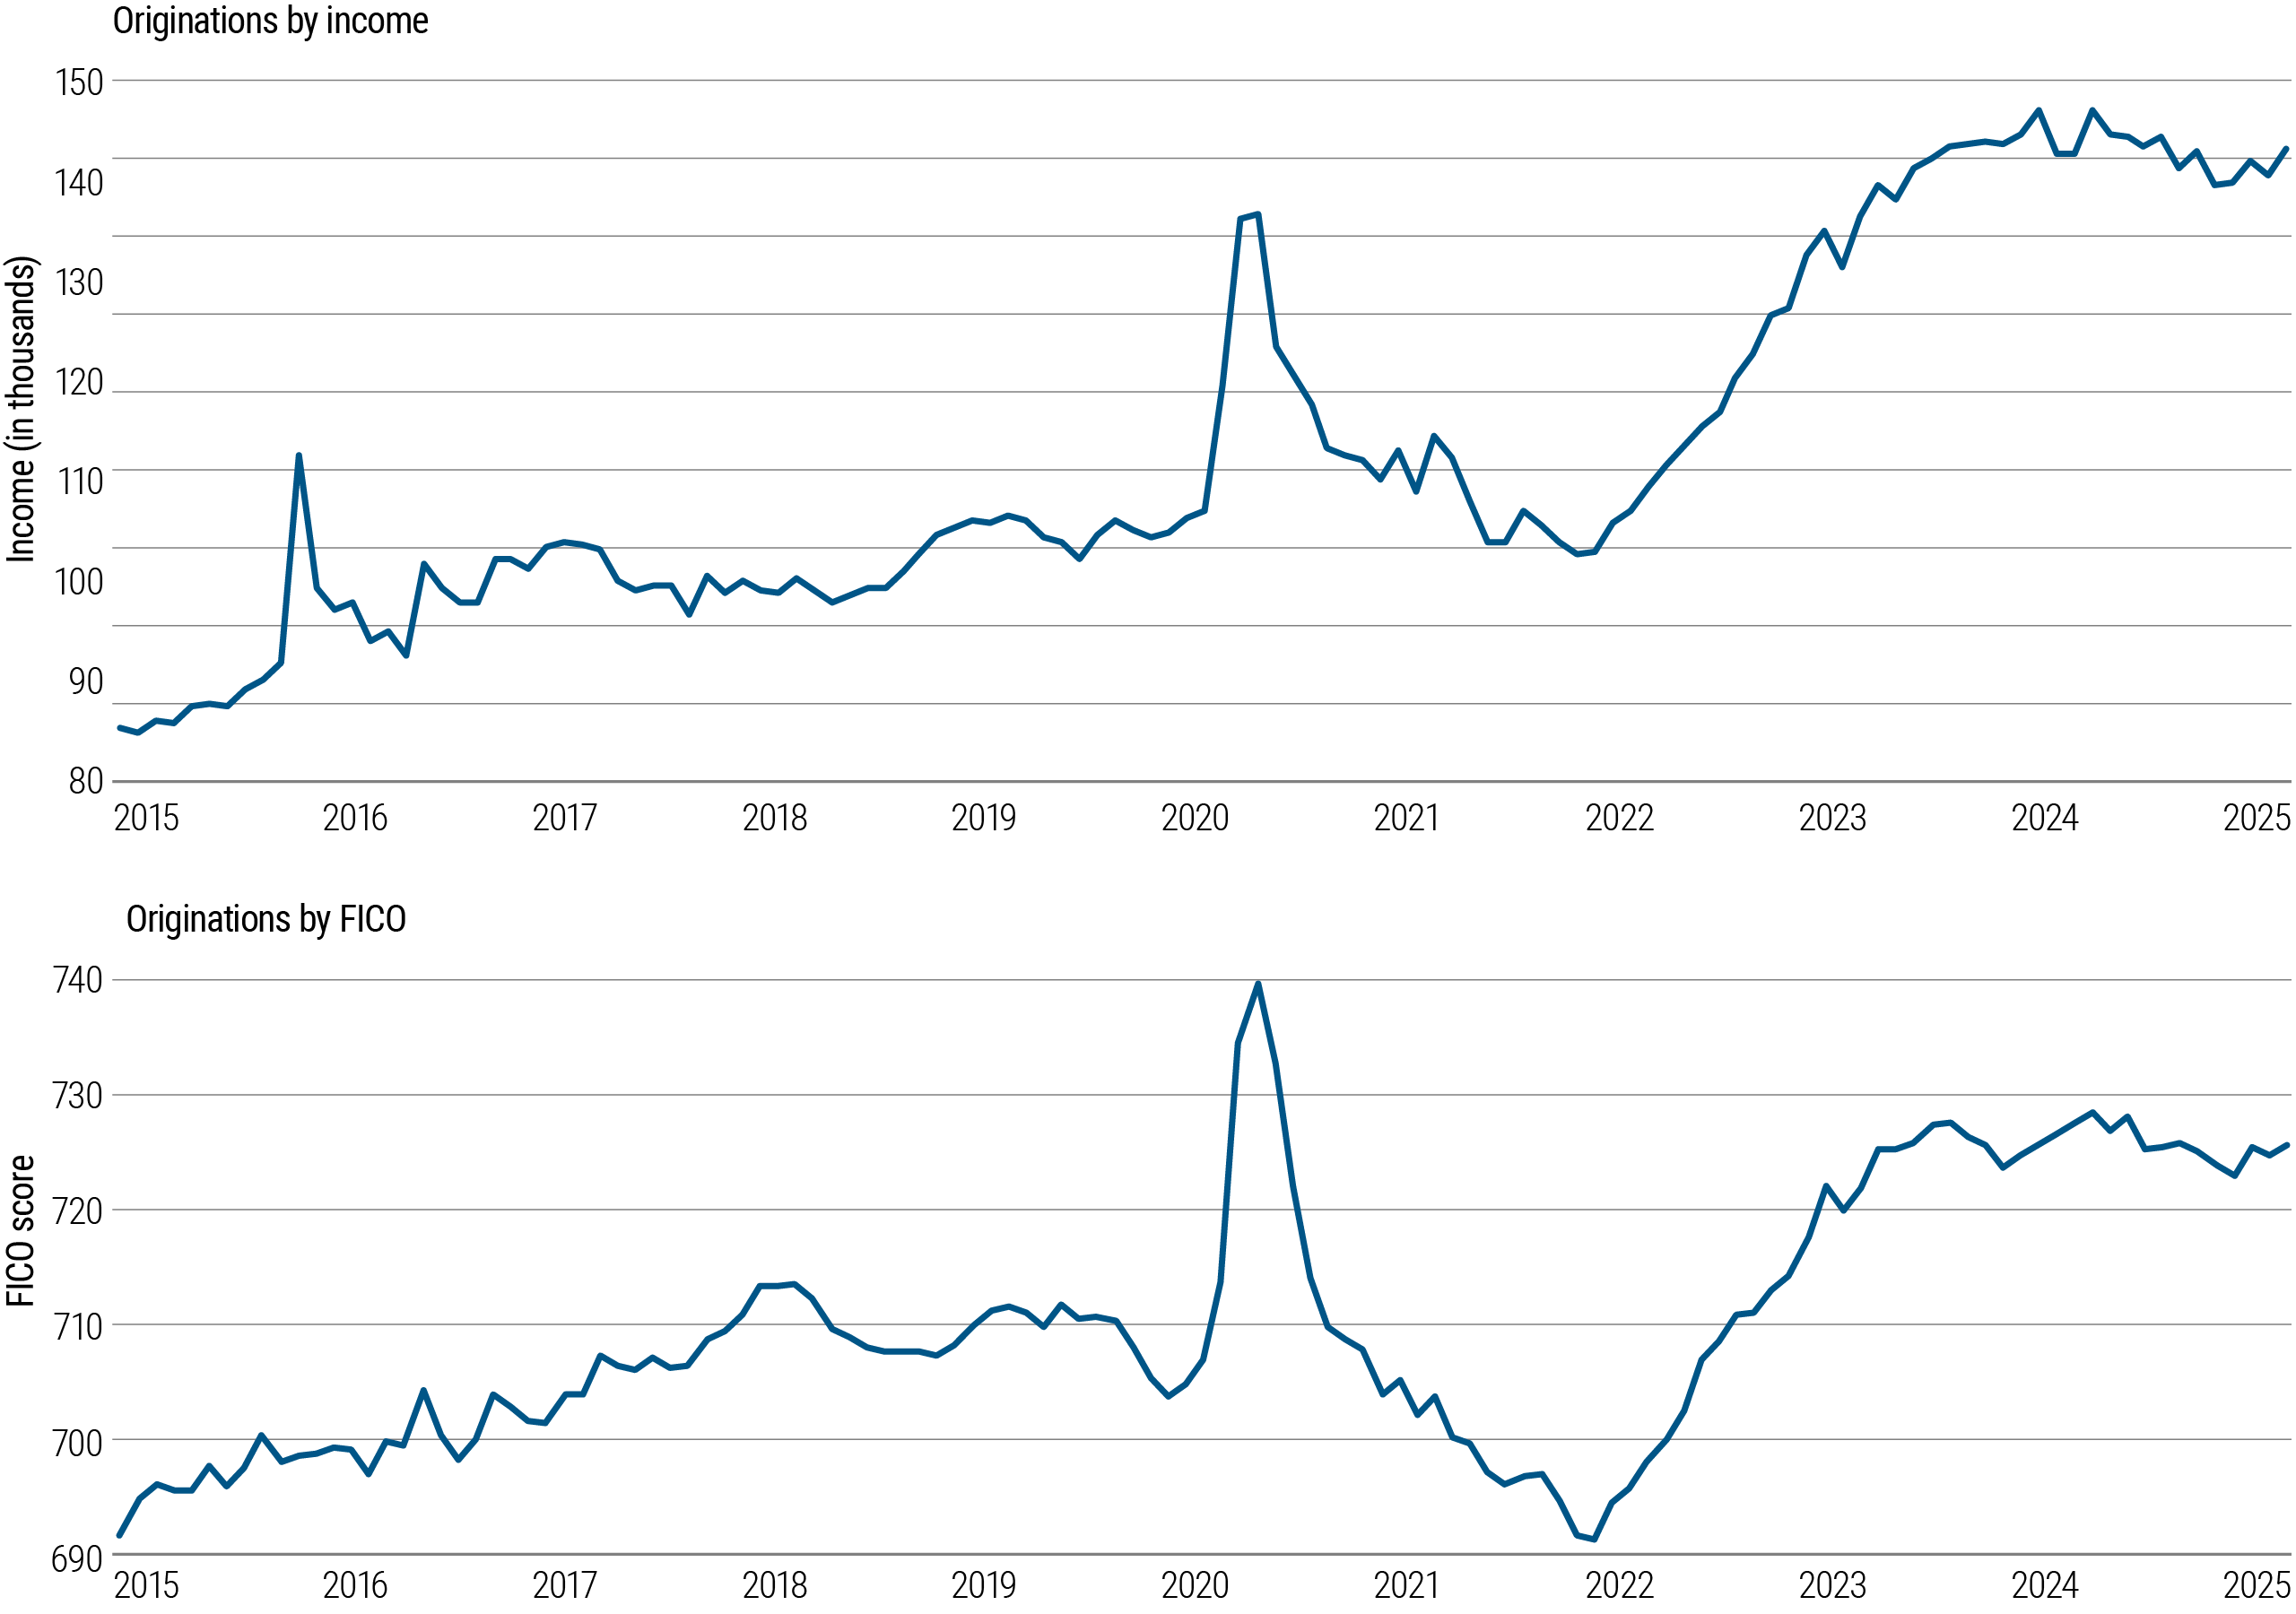
Source: Bloomberg data, PIMCO calculations as of 14 May 2025


