
Around the world, and particularly in Australia, we are seeing a significant shift in how major investors manage their assets. They are developing specialised teams to handle the implementation of their investments more effectively – some funds call these functions overlays, treasury, or exposure management.
Our research shows that by adopting capital-efficient strategies, Australian superannuation funds could see a substantial improvement in their risk-adjusted returns – a Sharpe ratio increase over 20% – compared with traditional optimisation methods that don’t take capital efficiency into account.
At PIMCO, we’ve been actively applying capital efficient methods within our portfolios for decades. We’ve also been advising asset owners globally on implementing these capital-efficient strategies across a range of asset classes. We believe that the adoption of capital-efficient strategies will gain further momentum among Australian asset owners, and investors who fail to embrace these practices may find themselves at a disadvantage compared with peers.
What is capital efficiency?
Capital efficiency is a straightforward yet powerful concept. It allows investors to gain exposure to assets like equities and bonds through derivatives, which require a minimal cash outlay compared with a direct investment in those assets. This frees up capital for investment in other assets with varying risk, return, and liquidity profiles.
While some investors view the concept of leverage with scepticism, most institutional portfolios inherently contain leverage through investments such as private equity and hedge funds.
In contrast, while capital efficiency potentially introduces accounting-based leverage, it does not necessarily equate to financial leverage. In practice, capital efficiency can actually reduce portfolio risk and market sensitivity by allowing for broader exposure to diversifying assets.Footnote[1] In a previous paper, we illustrated how a pragmatic implementation of capital-efficient strategies can enhance alpha and diversification, proving especially beneficial when expected returns for pro-cyclical assets are low.
How do asset owners use capital efficiency and what are the emerging trends?
The growing acceptance of derivatives and capital-efficient investing is likely to continue, with more than 80% of asset owners prioritising the enhancement of their investment execution functionsFootnote[2].
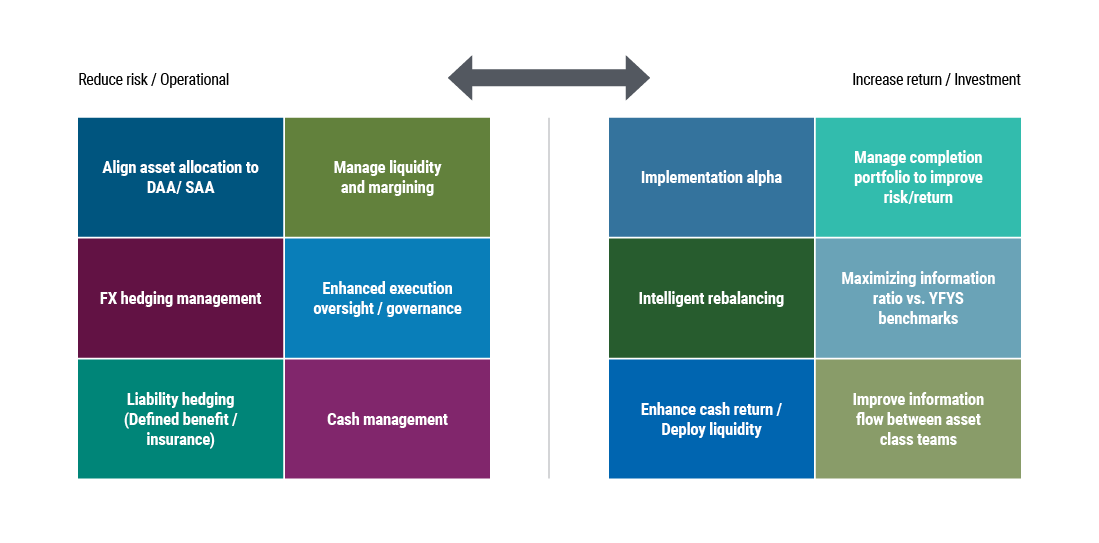
The primary performance indicators for overlays teams are cost savings from superior execution and the generation of alpha from active investment decisions. We’ve observed that many of our clients are on a multi-year journey where teams initially focused on operational tasks have evolved to materially contribute to the total portfolio’s risk-adjusted returns. Their objectives are shifting to alpha generation, acting as a risk management function and as a connection point between the fund and markets / counterparties. Figure 1 illustrates the variety in operational and cost-saving objectives (left-hand side) as well as the goals that are based on enhancing returns (right-hand side).
Our collaborations with prominent asset owners globally have led us to advocate for a hybrid model that combines internal and external execution capabilities. While large funds may find it cost-effective to develop internal execution capabilities, having access to an external partner with a global trading platform, active macro views, and expertise in niche markets can provide a strategic advantage, complementing internal capabilities. Such partnerships, which transcend traditional transactional broker relationships, can provide asset owners with access to strategic advice in volatile markets, sophisticated portfolio and risk management analytics, as well as attractive trading conditions with major counterparties.
Are the benefits of capital efficiency worth the complexity?
Establishing an overlays team that manages exposures across asset class teams and interfaces directly with the market is not without its challenges. Yet, the introduction of capital efficiency into the investment toolkit can yield significant advantages, particularly in enhancing the risk-return profile of the total portfolio.
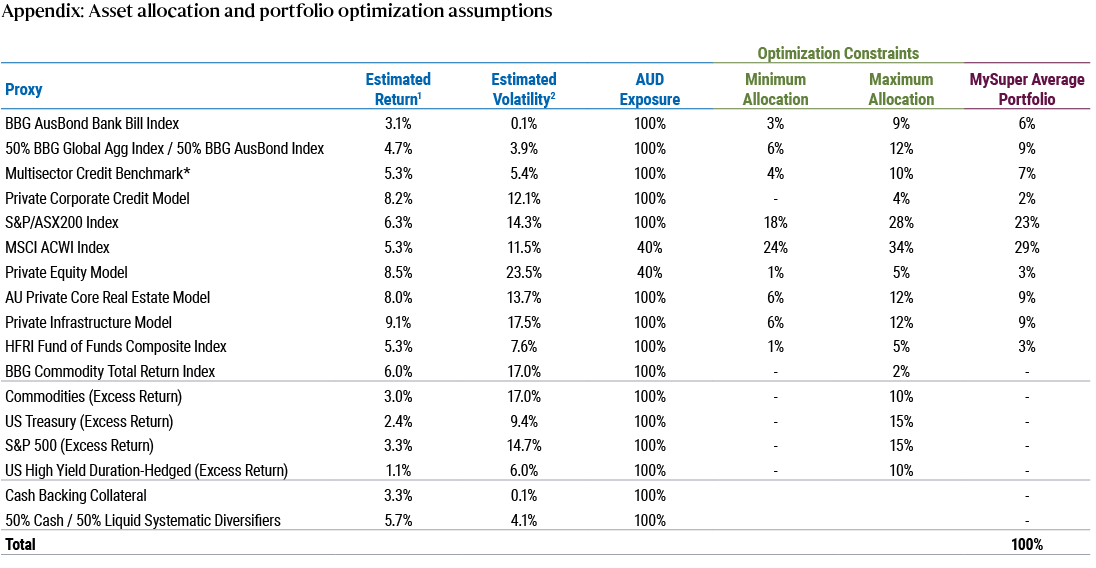
PIMCO’s five-year capital market assumptions indicate that the average Australian super fund is likely to underperform its CPI + objectivesFootnote[3]. To illustrate the impact of capital efficiency on the Sharpe ratio, we conducted mean-variance optimisations using a typical MySuper asset allocation as a starting point (see Appendix 1).
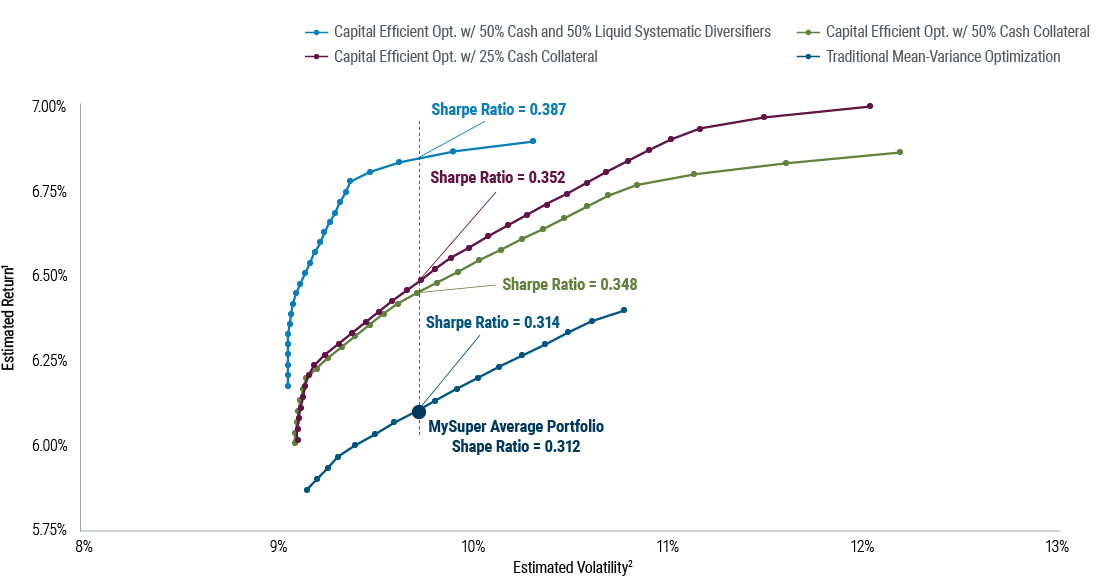
Figure 2 shows the distance between efficient frontiers generated from an optimisation with and without capital efficiency.Footnote[4]
The proximity of the current MySuper portfolio to the dark blue curve demonstrates that there is little room for improving the risk-return trade-off using traditional optimisation. However, the distance between the traditional efficient frontier and the three capital-efficient frontiers illustrates that capital-efficient optimisation can substantially elevate expected returns and/or reduce volatility.
The precise magnitude of the benefit from capital efficiency depends on the investor’s target risk-return level, but the current level of risk in the MySuper portfolio can be indicative.
For the same level of risk, the traditional optimisation (dark blue frontier) improves the return by only 2 bps with less than 1% increase in the Sharpe ratio. An optimisation that allows a maximum of 25% aggregate exposure to synthetic equities, interest rates, credit, and commodities could lift the average MySuper expected return by close to 40 bps with partial cash-backing (green and red frontiers) and by 75 bps when the exposures are fully backed by an equal mix of cash and liquid defensive assets (light blue frontier). This represents Sharpe ratio improvements of 13% and 22%, respectively, relative to the traditional optimisation.
Moreover, targeting a fixed return without deploying capital efficiency would necessitate a higher-risk portfolio. Conversely, with capital efficiency, the same return can be achieved with reduced volatility. For example, when targeting ~6.3% expected return, which is ~20 bps above the current MySuper portfolio, the traditional optimisation would lead to a portfolio with 10.4% volatility, while the capital efficient portfolios exhibit a volatility below 9.2% at the same level of return.
These efficiency gains are consistent with standard portfolio theory, which establishes that applying leverage to the tangency portfolioFootnote[5] on the efficient frontier can yield higher risk-adjusted returns compared with investing into other portfolios on the efficient frontier. In addition, we believe that unconstrained investors, who can tolerate capital efficiency, can capitalise on the general aversion to leverage that leads to behavioral anomalies, such as higher risk-adjusted returns for low beta stocks.
What are the key considerations for selecting assets for capital-efficient overlays?
When considering which assets are most suitable for derivatives-based replication, we evaluate:
- Financing Cost: The explicit cost of replicating the beta exposure, which varies by asset. As of February 2024, the cost for replication (expressed as the financing spread over SOFR) of U.S. large cap indices with 12-month TRS was around 50 bps, while it was ~30 bps for U.S. small cap indices and 10 bps for EM equities.
- Forgone Alpha: The opportunity cost of not holding the physical asset, which is particularly relevant in asset classes where active management outperforms passive strategies. In our view, investors should hold physical exposures in asset classes with higher expected alpha. For example, according to our research, active equity mutual funds underperform their median passive counterparts on average, whereas active bond mutual funds tend to outperform median passive peers.
- Tracking Error: The degree to which the synthetic instrument tracks the cash index. It is also important to understand how tracking error may increase during a crisis.
How might investors consider structuring capital-efficient solutions?
- Portable alpha – pairing equity beta with bond alpha: Investors can replicate equity markets with derivatives. While a fraction of the collateral would be invested in cash-like instruments for margin calls, the majority can be deployed to harvest fixed income alpha across core bonds or relative value strategies. In Australia, where super funds aim to maximise the information ratio relative to regulatory benchmarks, this may be a particularly compelling strategy.
- Capital-efficient global bonds: The primary objective is to achieve similar alpha and a low tracking error relative to flagship bond strategies with diversified active positions across duration, curve, spread and FX. The secondary objective is to maximise the use of derivatives to replace physical bonds and thereby increase cash exposure for yield-generating activities.
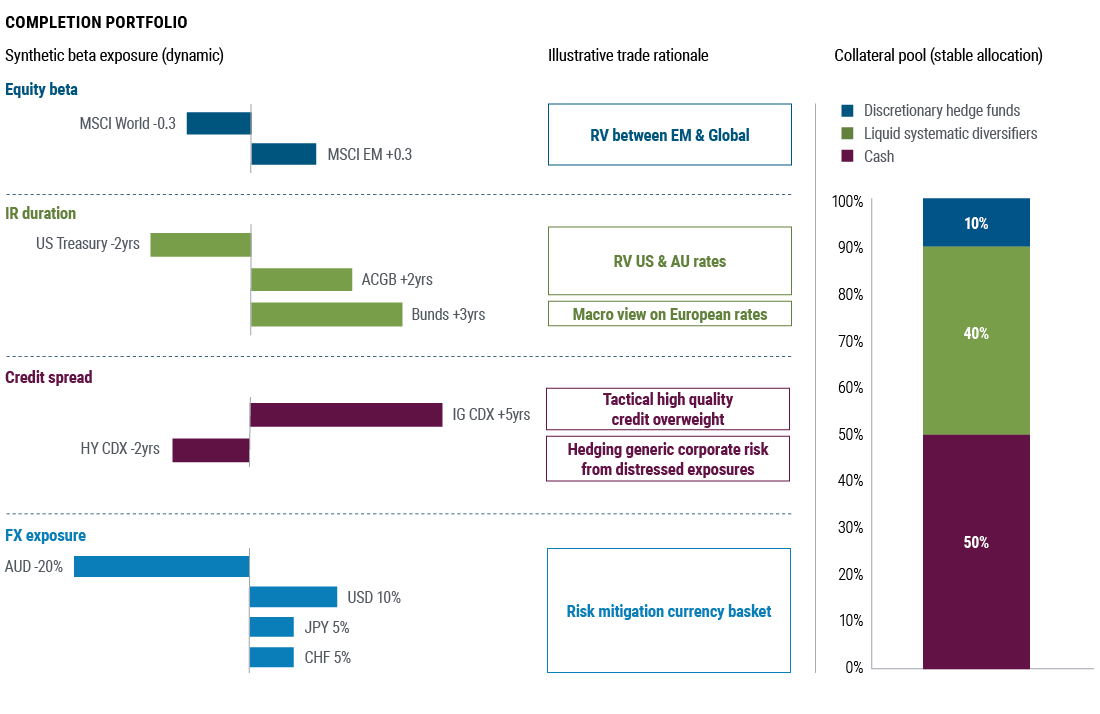
- Completion portfolio: This strategy enables asset owners to fully implement the total portfolio approach by dynamically sizing synthetic asset class exposures. Investors can trade across multiple markets, motivated by total portfolio considerations, rebalancing, or efficient implementation of macro and relative value views. In this case study, the collateral portfolio is designed to generate uncorrelated alpha with low standalone risk. Figure 3 shows an illustrative collateral portfolio of cash combined with systematic and discretionary alternatives, which, in combination, targets an attractive Sharpe ratio of 0.5 – 0.8 at mid-single-digit volatility and with modestly negative downside equity beta.Footnote[6]
Capital efficiency can provide a sustainable competitive advantage in investing
The strategic use of derivatives to gain asset class exposures, coupled with the active management of collateral in enhanced cash strategies or liquid diversifiers, can significantly enhance portfolio construction.
A centralised overlays function can not only streamline operations but also improve financial performance, enabling asset owners to execute a total portfolio approach.
We believe that the adoption of capital efficiency will continue to escalate, with a focus on adding value to the investment process and amplifying fund-level risk-adjusted returns.
Investors who neglect capital efficiency may be compelled to assume greater pro-cyclical risk to maintain parity with peers who are harnessing this powerful tool.
[1] For example, government bonds may be an attractive asset today, but CPI+ investors may struggle to reduce allocations to higher-returning assets. A capital efficient solution could use interest rate swaps or bond futures, or replace a fraction of equity exposure with total return swaps and invest the collateral in fixed income.Return to content
[2] According to a survey of large Australian asset owners by the Centre for Institutional Investors in September 2023.Return to content
[3] Based on average MySuper asset allocation (see Appendix 1) and PIMCO’s capital market assumptions, the expected portfolio return is 6.1% p.a., which is slightly higher than a 60/40 stock-bond mix, but below current inflation expectations plus 4% (=6.5%).Return to content
[4] To constrain turnover, we allow the optimizer to modify the allocation +/- 2-5% depending on each asset’s initial weight (see Appendix 1). We also constrain changes to listed equities and illiquid assets in a +/- 5% range to largely preserve the starting portfolio characteristics. We allow for max. 25% capital-efficient exposure split between max. 15% each in stocks (S&P 500) and rates (US Treasury Futures) as well as max. 10% each in duration-hedged US HY and commodities. We model variations of collateral, starting by requiring 50% of synthetic exposures backed by enhanced cash (assumed to generate a modest 20 bps above the cash rate). Then, we reduce the cash-backing requirement to 25% of synthetic exposures. Lastly, we require 100% asset backing, which is invested 50% in enhanced cash and 50% in defensive alternatives (equal blend of trend-following and alternative risk premia).Return to content↩
[5] The tangency portfolio is the portfolio on the efficient frontier that has the highest risk-adjusted return.Return to content
[6] In general, the collateral can be structured to target different liquidity, return, risk, and diversification objectives depending on investor risk appetite and the risk within the beta exposure. Investors tend to target a collateral portfolio with little to no traditional factor footprint.Return to content


