
Executive summary
- We strongly favor fixed income in multi-asset portfolios. Given current valuations and an outlook for challenging economic growth and diminishing inflation, we believe bonds have rarely appeared more compelling than equities. We also look to maintain portfolio flexibility in light of macro and market risks.
- Duration offers attractive value at current yields, and we hold overweight positions in the U.S. and also in Australia, Canada, the U.K., and Europe. In the credit space, we favor mortgage-backed assets and select securitized bonds.
- We maintain an overall neutral stance on equities, which appear richly valued by several measures, though they should return to more reasonable levels over time. An active approach can help us pinpoint opportunities in a differentiated stock market; we are focusing on quality and longer-term resilience.
The global economic outlook along with market valuations and asset class fundamentals all lead us to favor fixed income. Relative to equities, we believe bonds have rarely been as attractive as they appear today. After a turbulent couple of years of high inflation and rising rates that challenged portfolios, investors may see a return to more conventional behavior in both stock and bond markets in 2024 – even as growth is hindered in many regions.
In this environment, bonds appear poised to perform well, while equities could see lower (though still positive) risk-adjusted returns in a generally overvalued market. Risks still surround the macro and geopolitical outlook, so portfolio flexibility remains key.
Macro outlook suggests a return of the inverse stock/bond relationship
In PIMCO’s recent Cyclical Outlook, “Post Peak,” we shared our baseline outlook for a slowdown in developed markets (DM) growth and, in some regions, the potential for contraction next year as fiscal support ends and monetary policy takes effect (after its typical lag). Our business cycle model indicates a 77% probability that the U.S. is currently in the “late cycle” phase and signals around a 50% probability of a U.S. recession within one year.
Growth has likely peaked, but so has inflation, in our view. As price levels get closer to central bank targets in 2024, bonds and equities should resume their more typical inverse relationship (i.e., negative correlation) – meaning bonds tend to do well when equities struggle, and vice versa. The macro forecast favors bonds in this trade-off: U.S. Treasuries historically have tended to provide attractive risk-adjusted returns in such a "post-peak" environment, while equities have been more challenged.
Valuations and current levels may strongly favor fixed income
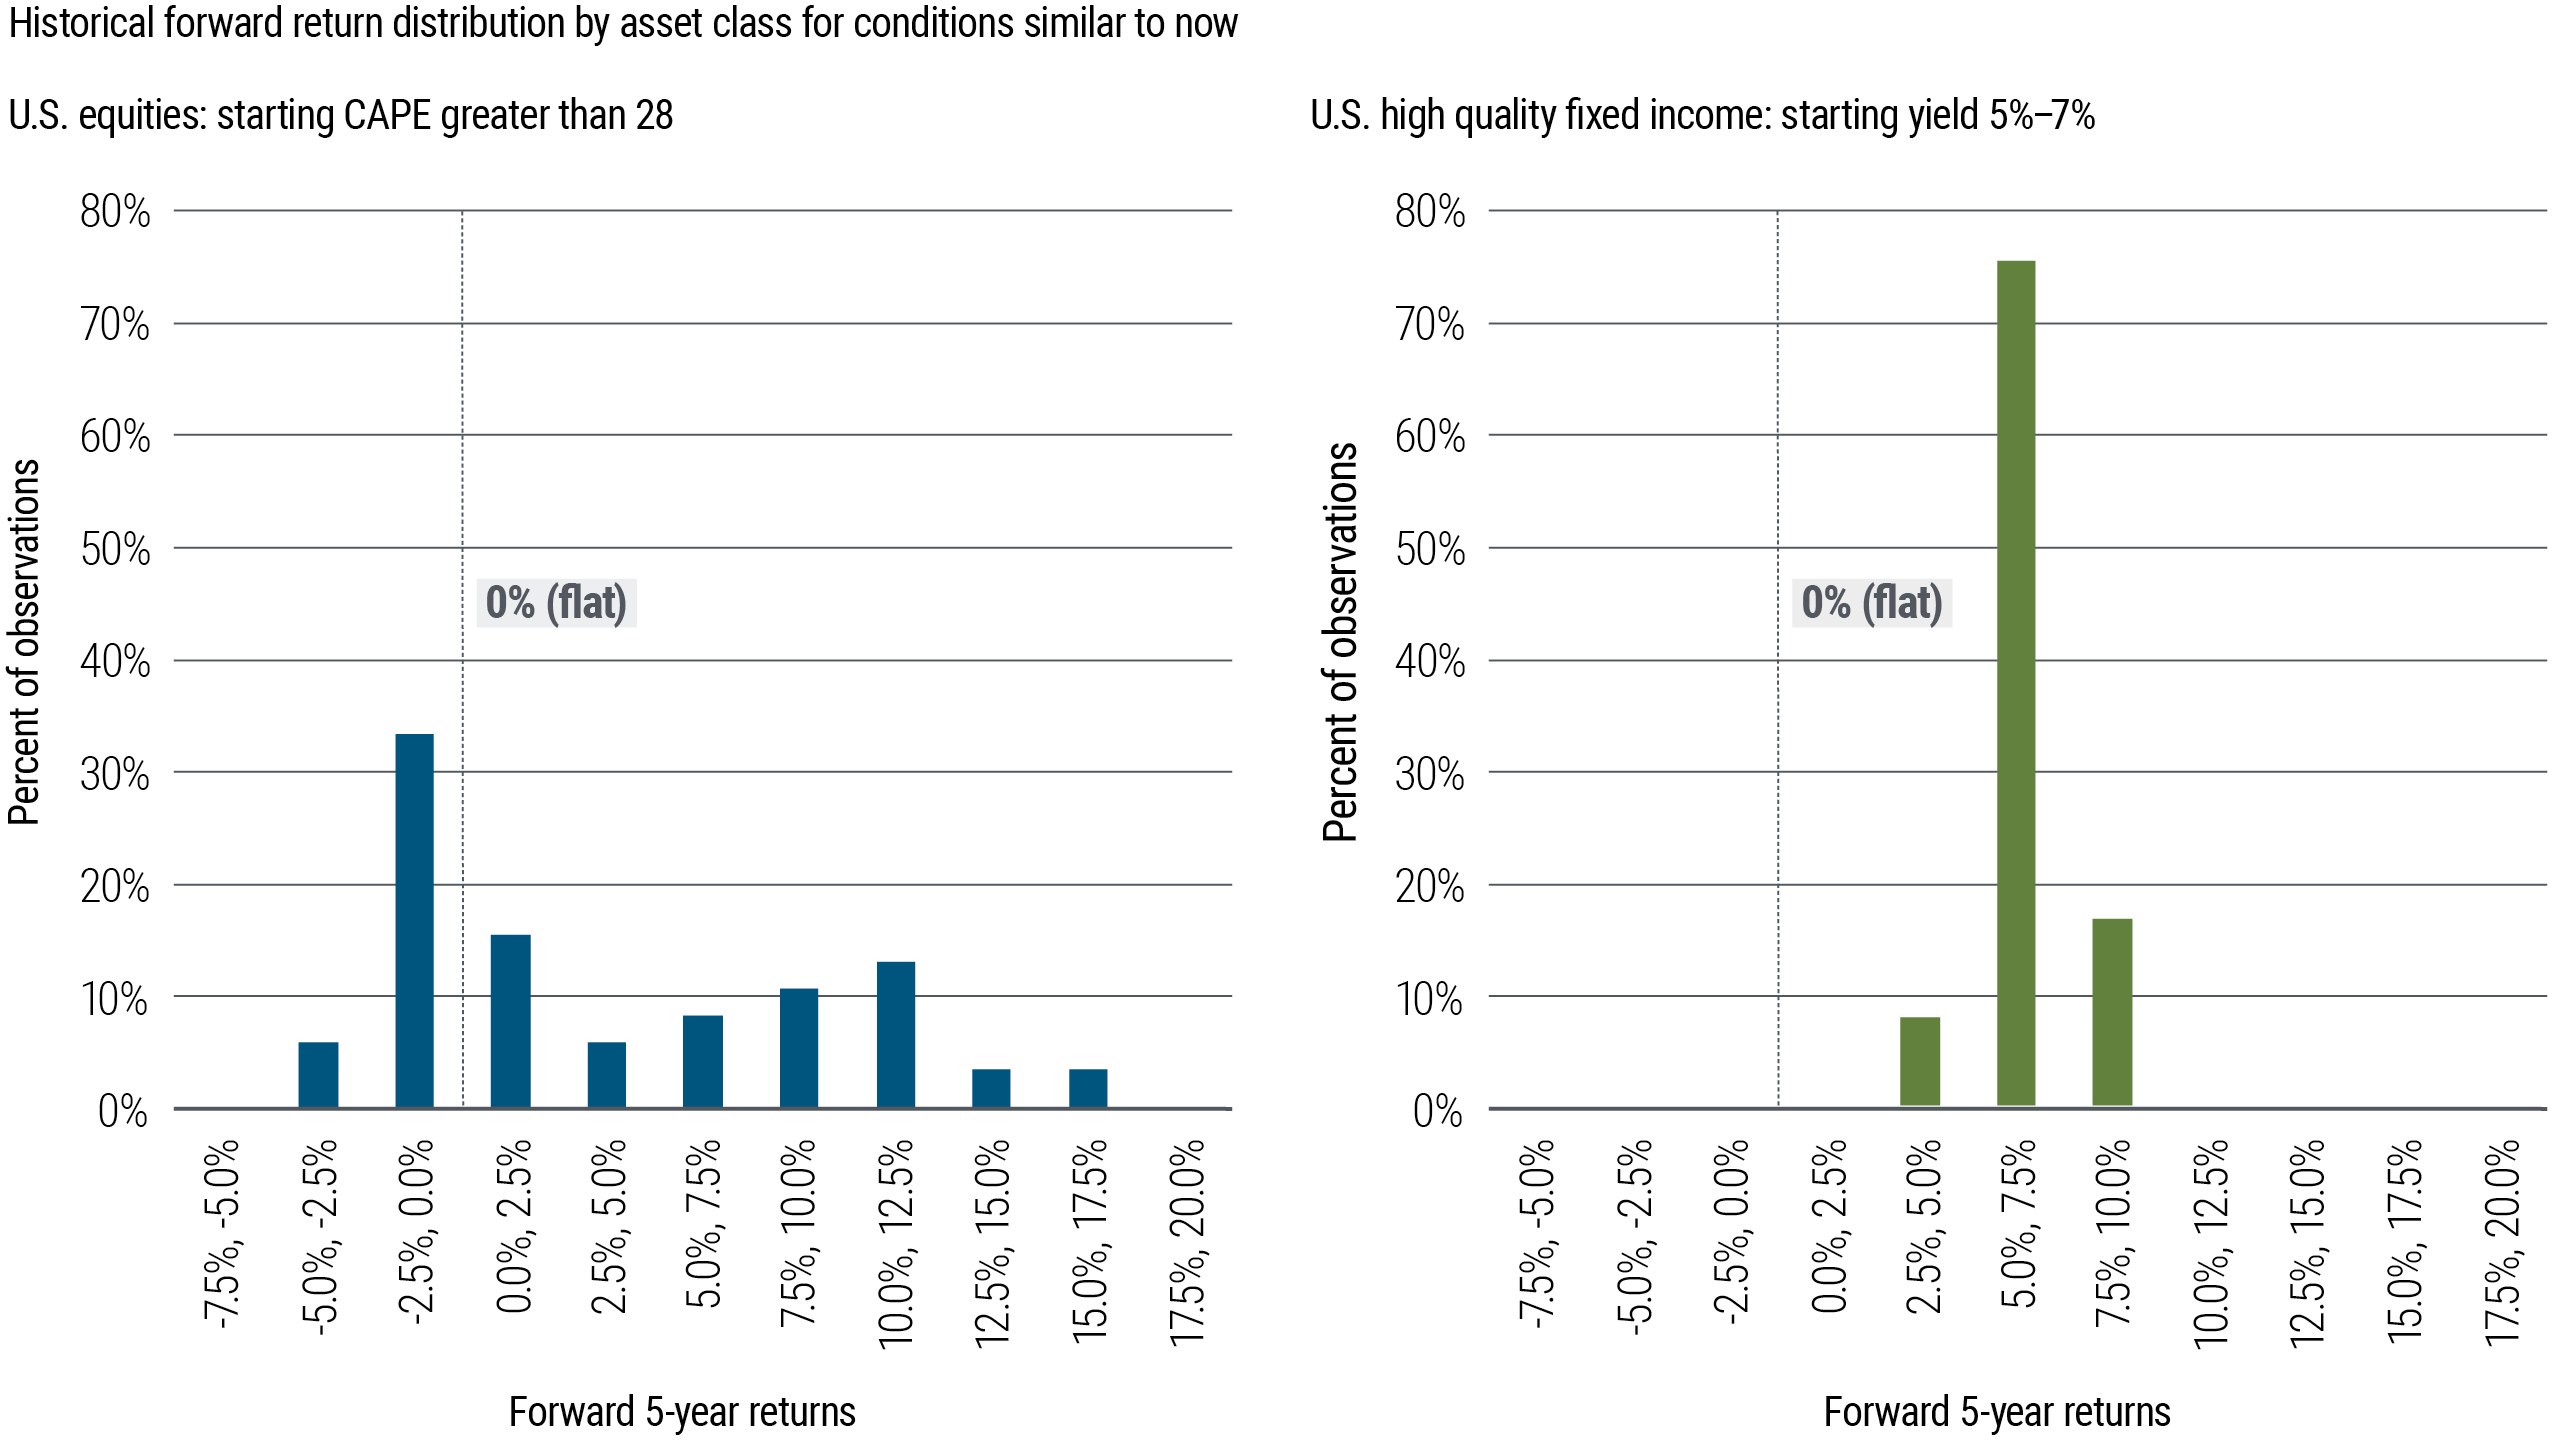
Although not always a perfect indicator, the starting levels of bond yields or equity multiples historically have tended to signal future returns. Figure 1 shows that today’s yield levels in high-quality bonds on average have been followed by long-term outperformance (typically an attractive 5%–7.5% over the subsequent five years), while today’s level of the cyclically adjusted price/earnings (CAPE) ratio has tended to be associated with long-term equity underperformance. Additionally, bonds have historically provided these return levels more consistently than equities – see the tighter (more “normal”) distribution of the return outcomes. It’s a compelling statement for fixed income.
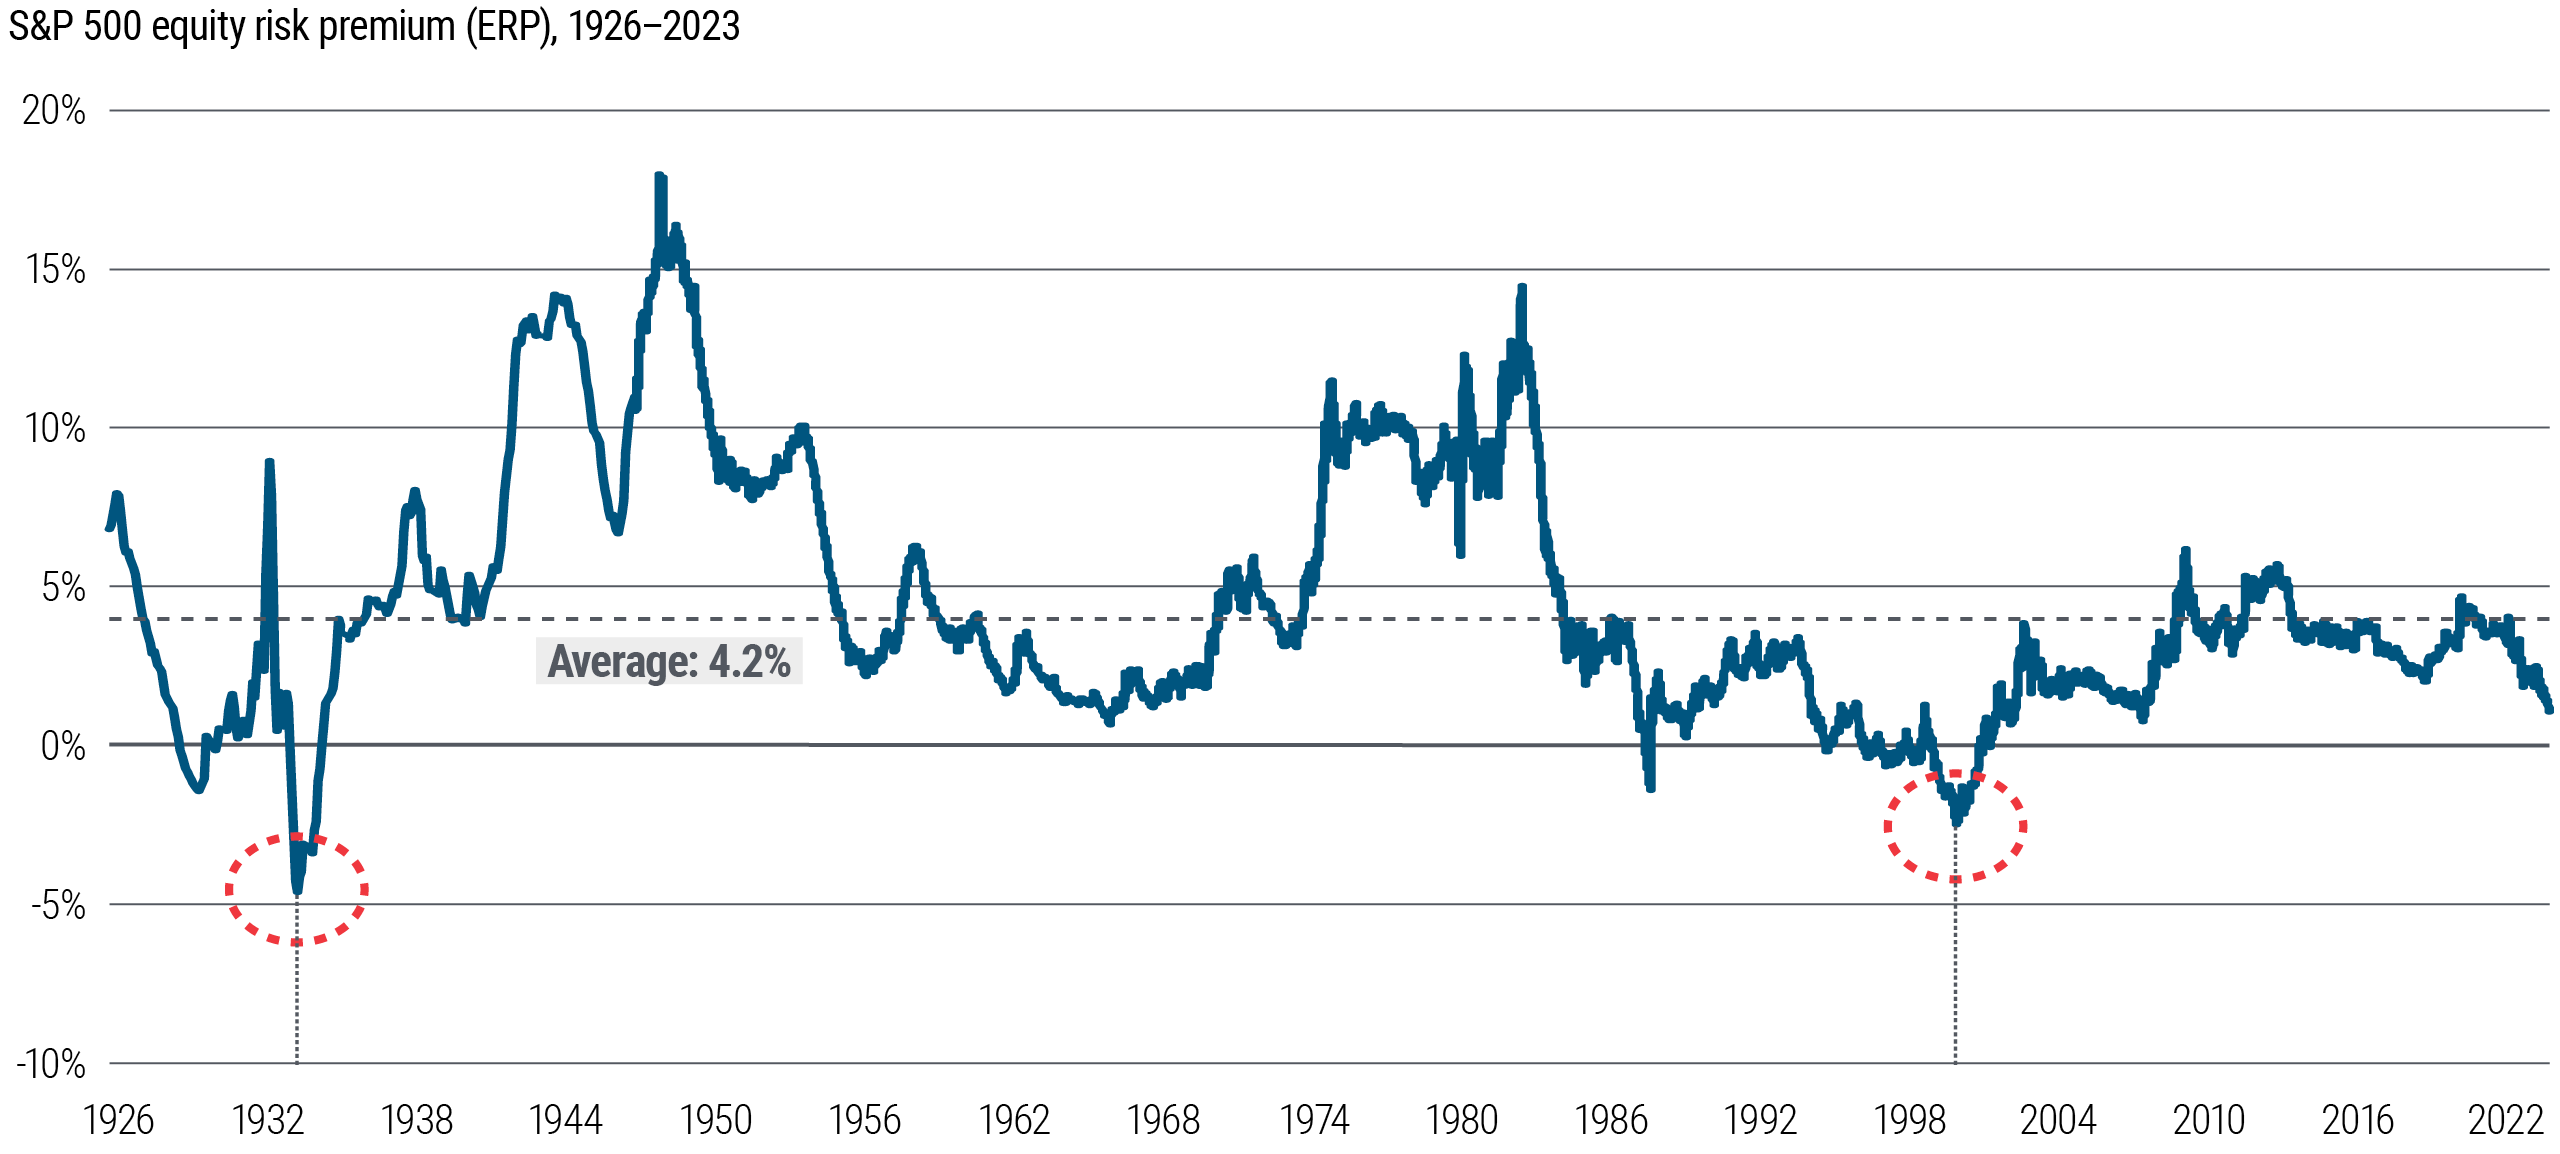
Delving deeper into historical data, we find that in the past century there have been only a handful of instances when U.S. equities have been more expensive relative to bonds – such as during the Great Depression and the dot-com crash. One common way to measure relative valuation for bonds versus equities is the equity risk premium or ERP (there are several ways to calculate an ERP, but here we use the inverse of the price/earnings ratio of the S&P 500 minus the 10-year U.S. Treasury yield). The ERP is currently at just over 1%, a low not seen since 2007 (see Figure 2). History suggests equities likely won’t stay this expensive relative to bonds; we believe now may be an optimal time to consider overweighting fixed income in asset allocation portfolios.
Price/earnings (P/E) ratios, are another way that equities, especially in the U.S., are screening rich, in our view – not only relative to bonds, but also in absolute.
Over the past 20 years, S&P 500 valuations have averaged 15.4x NTM (next-twelve-month) P/E. Today, that valuation multiple is significantly higher, at 18.1x NTM P/E. This valuation takes into account an estimated increase of 12% in earnings per share (EPS) over the coming year, an estimate we find unusually high in an economy facing a potential slowdown. If we assume, hypothetically, a more normal level of 7% EPS growth in 2024, then the S&P today would be trading even richer at 18.6x NTM P/E, while if we are more conservative and assume 0% EPS growth in 2024, then today’s valuation would rise to 19.2x NTM P/E. Such an extreme level, in our view, would likely drive multiple contraction (when share prices fall even when earnings are flat) if flat EPS came to pass.
We note, however, a crucial differentiation within the equity market: If we exclude the seven largest technology companies from this calculation, then the remainder of the S&P trades close to the long-term average at 15.6x NTM P/E. This differentiation could present compelling opportunities for alpha generation through active management.
Overall, we feel that robust forward earnings expectations might face disappointment in a slowing economy, which, coupled with elevated valuations in substantial parts of the markets, warrants a cautious neutral stance on equities, favoring quality and relative value opportunities.
Equity fundamentals support cautious stance
Our models suggest equity investors appear more optimistic on the economy than corporate credit investors. We use ERP, EPS, and CDX (Credit Default Swap Index) spreads to estimate recession probability implied by different asset classes, calculated by comparing today’s levels with typical recessionary environments. The S&P 500 (via ERP and EPS spreads) is currently reflecting a 14% chance of a recession, which is significantly lower than the estimates implied by high yield credit at 42% (via CDX).
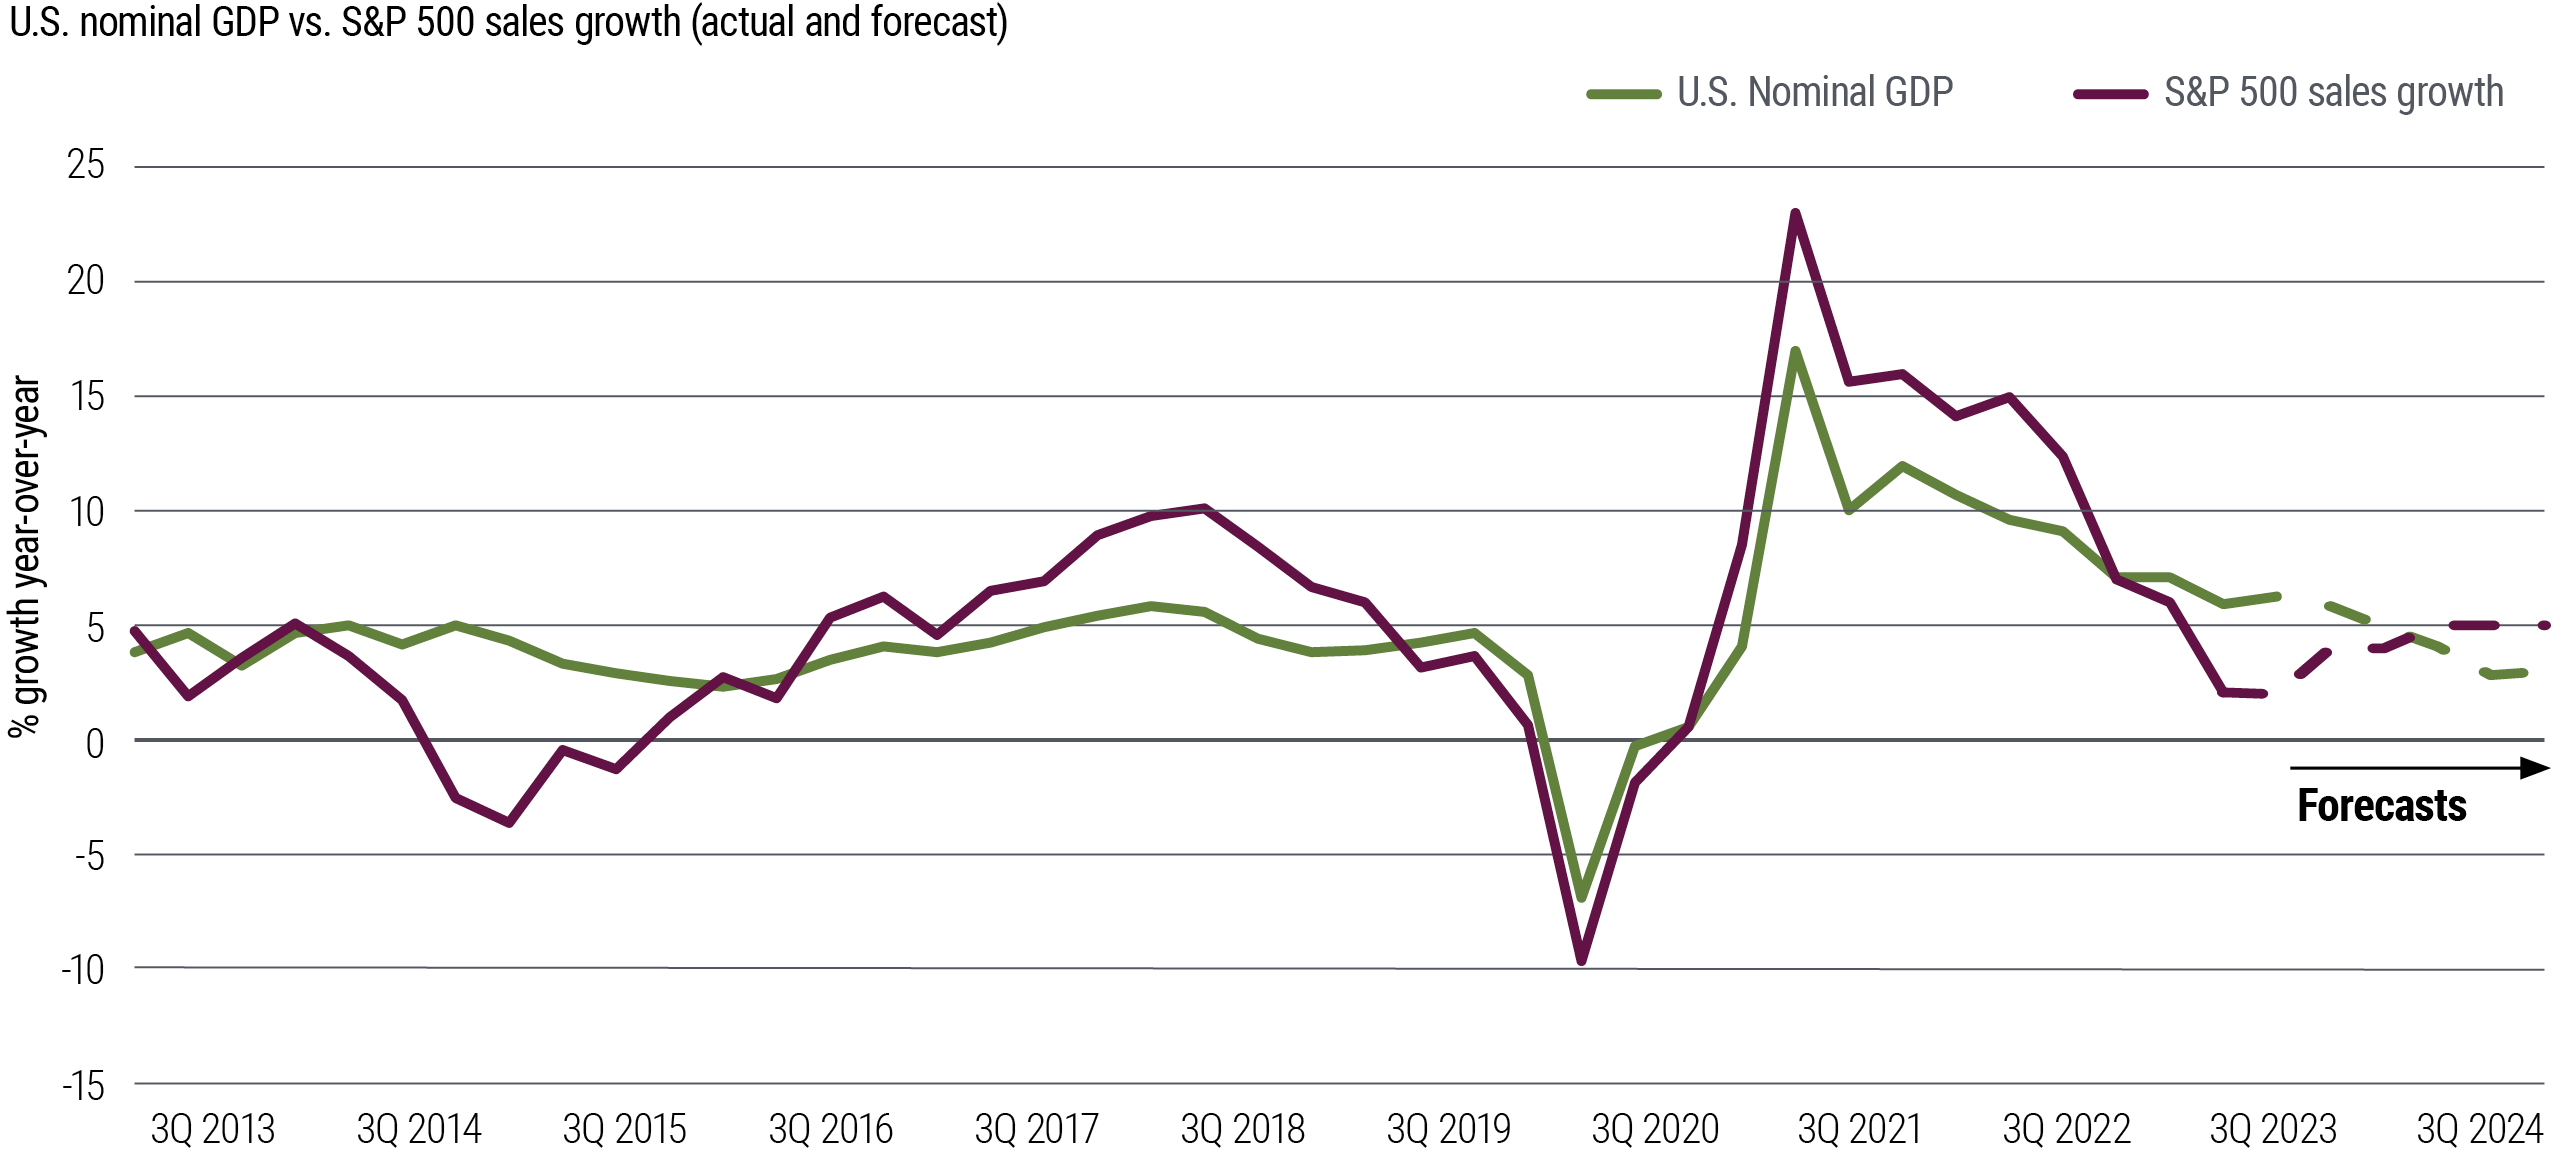
Such optimism is underscored by consensus earnings and sales estimates for the S&P 500, which anticipate a reacceleration rather than a slowdown (see Figure 3). We’re concerned about a potential disconnect between our macro outlook and these equity earnings estimates and valuations. It reinforces our caution on the asset class.
Managing risks to the macro baseline
We recognize risks to our outlook for slowing growth and inflation. Perhaps the resilient U.S. economy will stave off recession, but also drive overheating growth and accelerating inflation that prompts much more restrictive monetary policy. There’s also potential for a hard landing, where growth and inflation fall quickly.
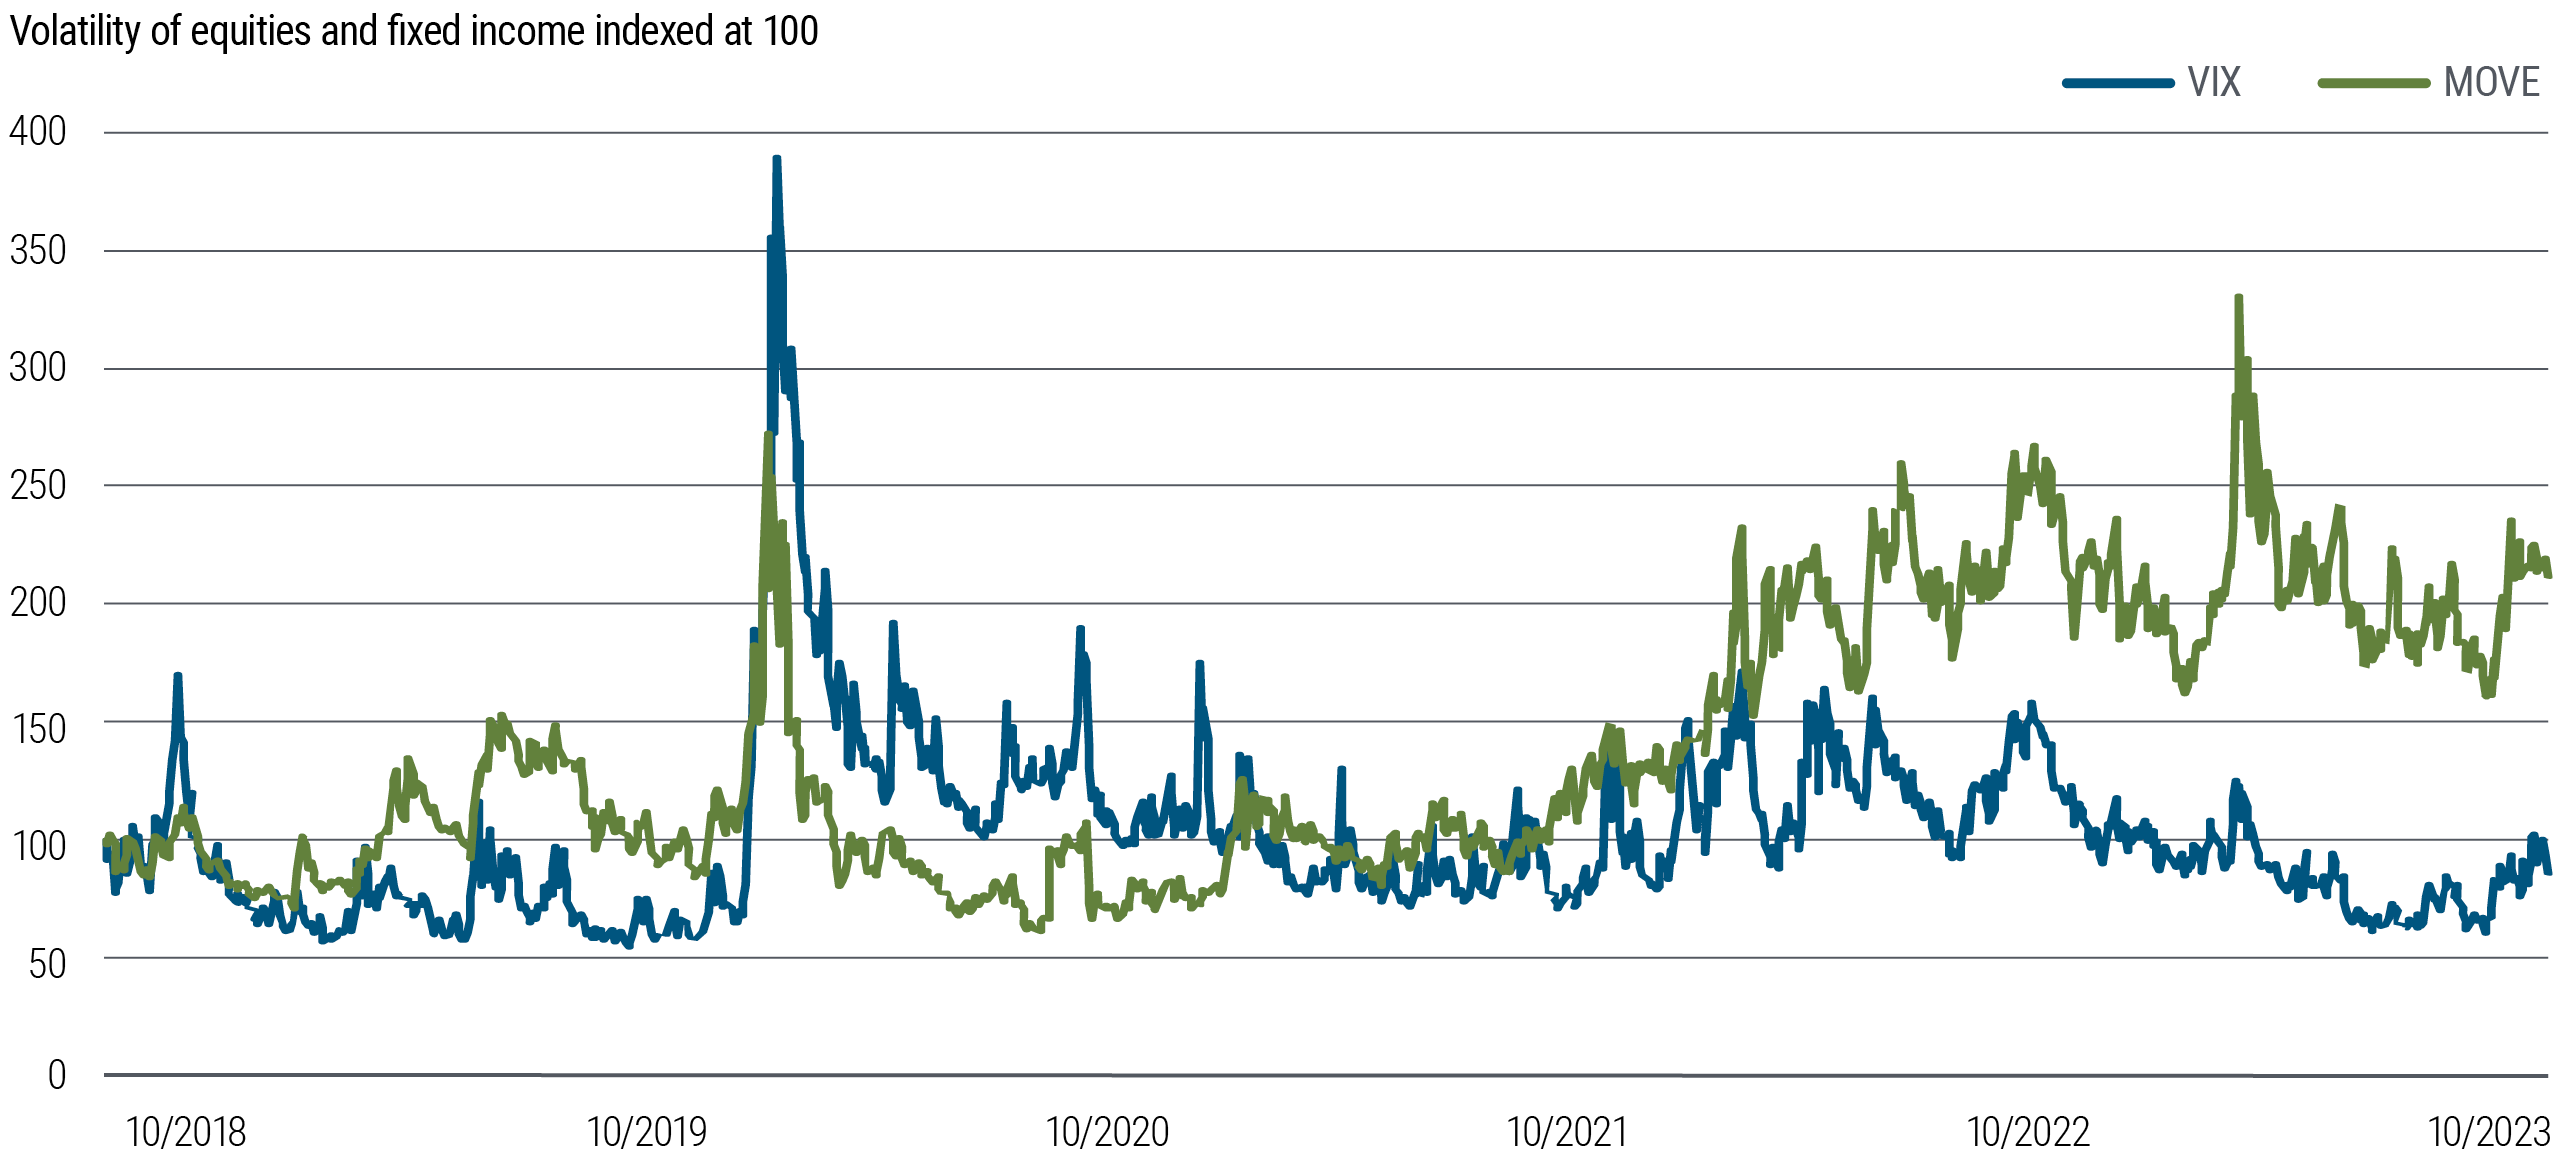
In light of these risk scenarios we believe it’s prudent to include hedges and to build optionality – and managing volatility, especially in equities, is attractively inexpensive (see Figure 4). For example, one strategy we favor is a “reverse seagull” – a put spread financed by selling a call option.
Investment themes amid elevated uncertainty
Within multi-asset portfolios, we believe the case for fixed income is compelling, but we look across a wide range of investment opportunities We are positioned for a range of macroeconomic and market outcomes, and we emphasize diversification, quality, and flexibility.
Duration: high quality opportunities
At today’s starting yields we would favor fixed income on a standalone basis; the comparison with equity valuations simply strengthens our view. Fixed income offers potential for attractive returns and can help cushion portfolios in a downturn. Given macro uncertainties, we actively manage and diversify our duration positions with an eye toward high quality and resilient yields.
Medium-term U.S. duration is particularly appealing. We also see attractive opportunities in Australia, Canada, the U.K., and Europe. The first two tend to be more rate-sensitive as a large portion of homeowners have a floating mortgage rate, while the latter two could be closer to recession than the U.S. given recent macro data. Central bank policies in these regions could diverge, and we will monitor the bond holdings on their balance sheets for potential impact on rates and related positions.
In emerging markets, we hold a duration overweight in countries with high credit quality, high real rates, and attractive valuations and return potential. Brazil and Mexico, where the disinflation process is further along and real rates are distinctly high, stand out to us.
By contrast, we are underweight duration in Japan, where monetary policy may tighten notably as inflation heats up.
While we recognize cash rates today are more attractive than they’ve been in a long time, we favor moving out along the maturity spectrum in an effort to lock in yields and anchor portfolios over the medium term. If history is a guide, duration has significant potential to outperform cash especially at this stage of the monetary policy cycle.
Equities: relative value is key
Although the S&P 500 appears expensive in aggregate, we see potential for differentiation and opportunities for thematic trades. From a macro perspective, there’s also the potential for economic resilience (such as a strong U.S. consumer) to support equity markets more than we currently forecast. Accordingly, we are neutral in equities within multi-asset portfolios. An active approach can help target potential winners.
In uncertain times, we prefer to invest in quality stocks. Historically, the quality factor has offered an attractive option for the late phase of a business cycle (see Figure 5). Within our overall neutral position, we are overweight U.S. equities (S&P 500), which present more quality characteristics than those in other regions, especially emerging markets. Also, European growth could be more challenged than in the U.S., so we are underweight the local equity market despite its more attractive valuation.
We also favor subsectors supported by fiscal measures that may benefit from long-cycle projects and strong secular tailwinds. The U.S. Inflation Reduction Act, for example, supports many clean energy sectors (hydrogen, solar, wind) with meaningful tax credits.
On the short side of an equity allocation, we focus on rate-sensitive industries, particularly consumer cyclical sectors such as homebuilders. Autos could also suffer from higher-for-longer; interest rates, but as supply normalizes, we think demand will struggle to keep up.
Credit and securitized assets
In the credit space we favor resilience, with an emphasis on relative value opportunities. We remain cautious on corporate credit, though an active focus on individual sectors can help mitigate risks in a downturn. We are underweight lower-quality, floating-rate corporate credit, such as bank loans and certain private assets, which remain the most susceptible to high rates and are already showing signs of strain.
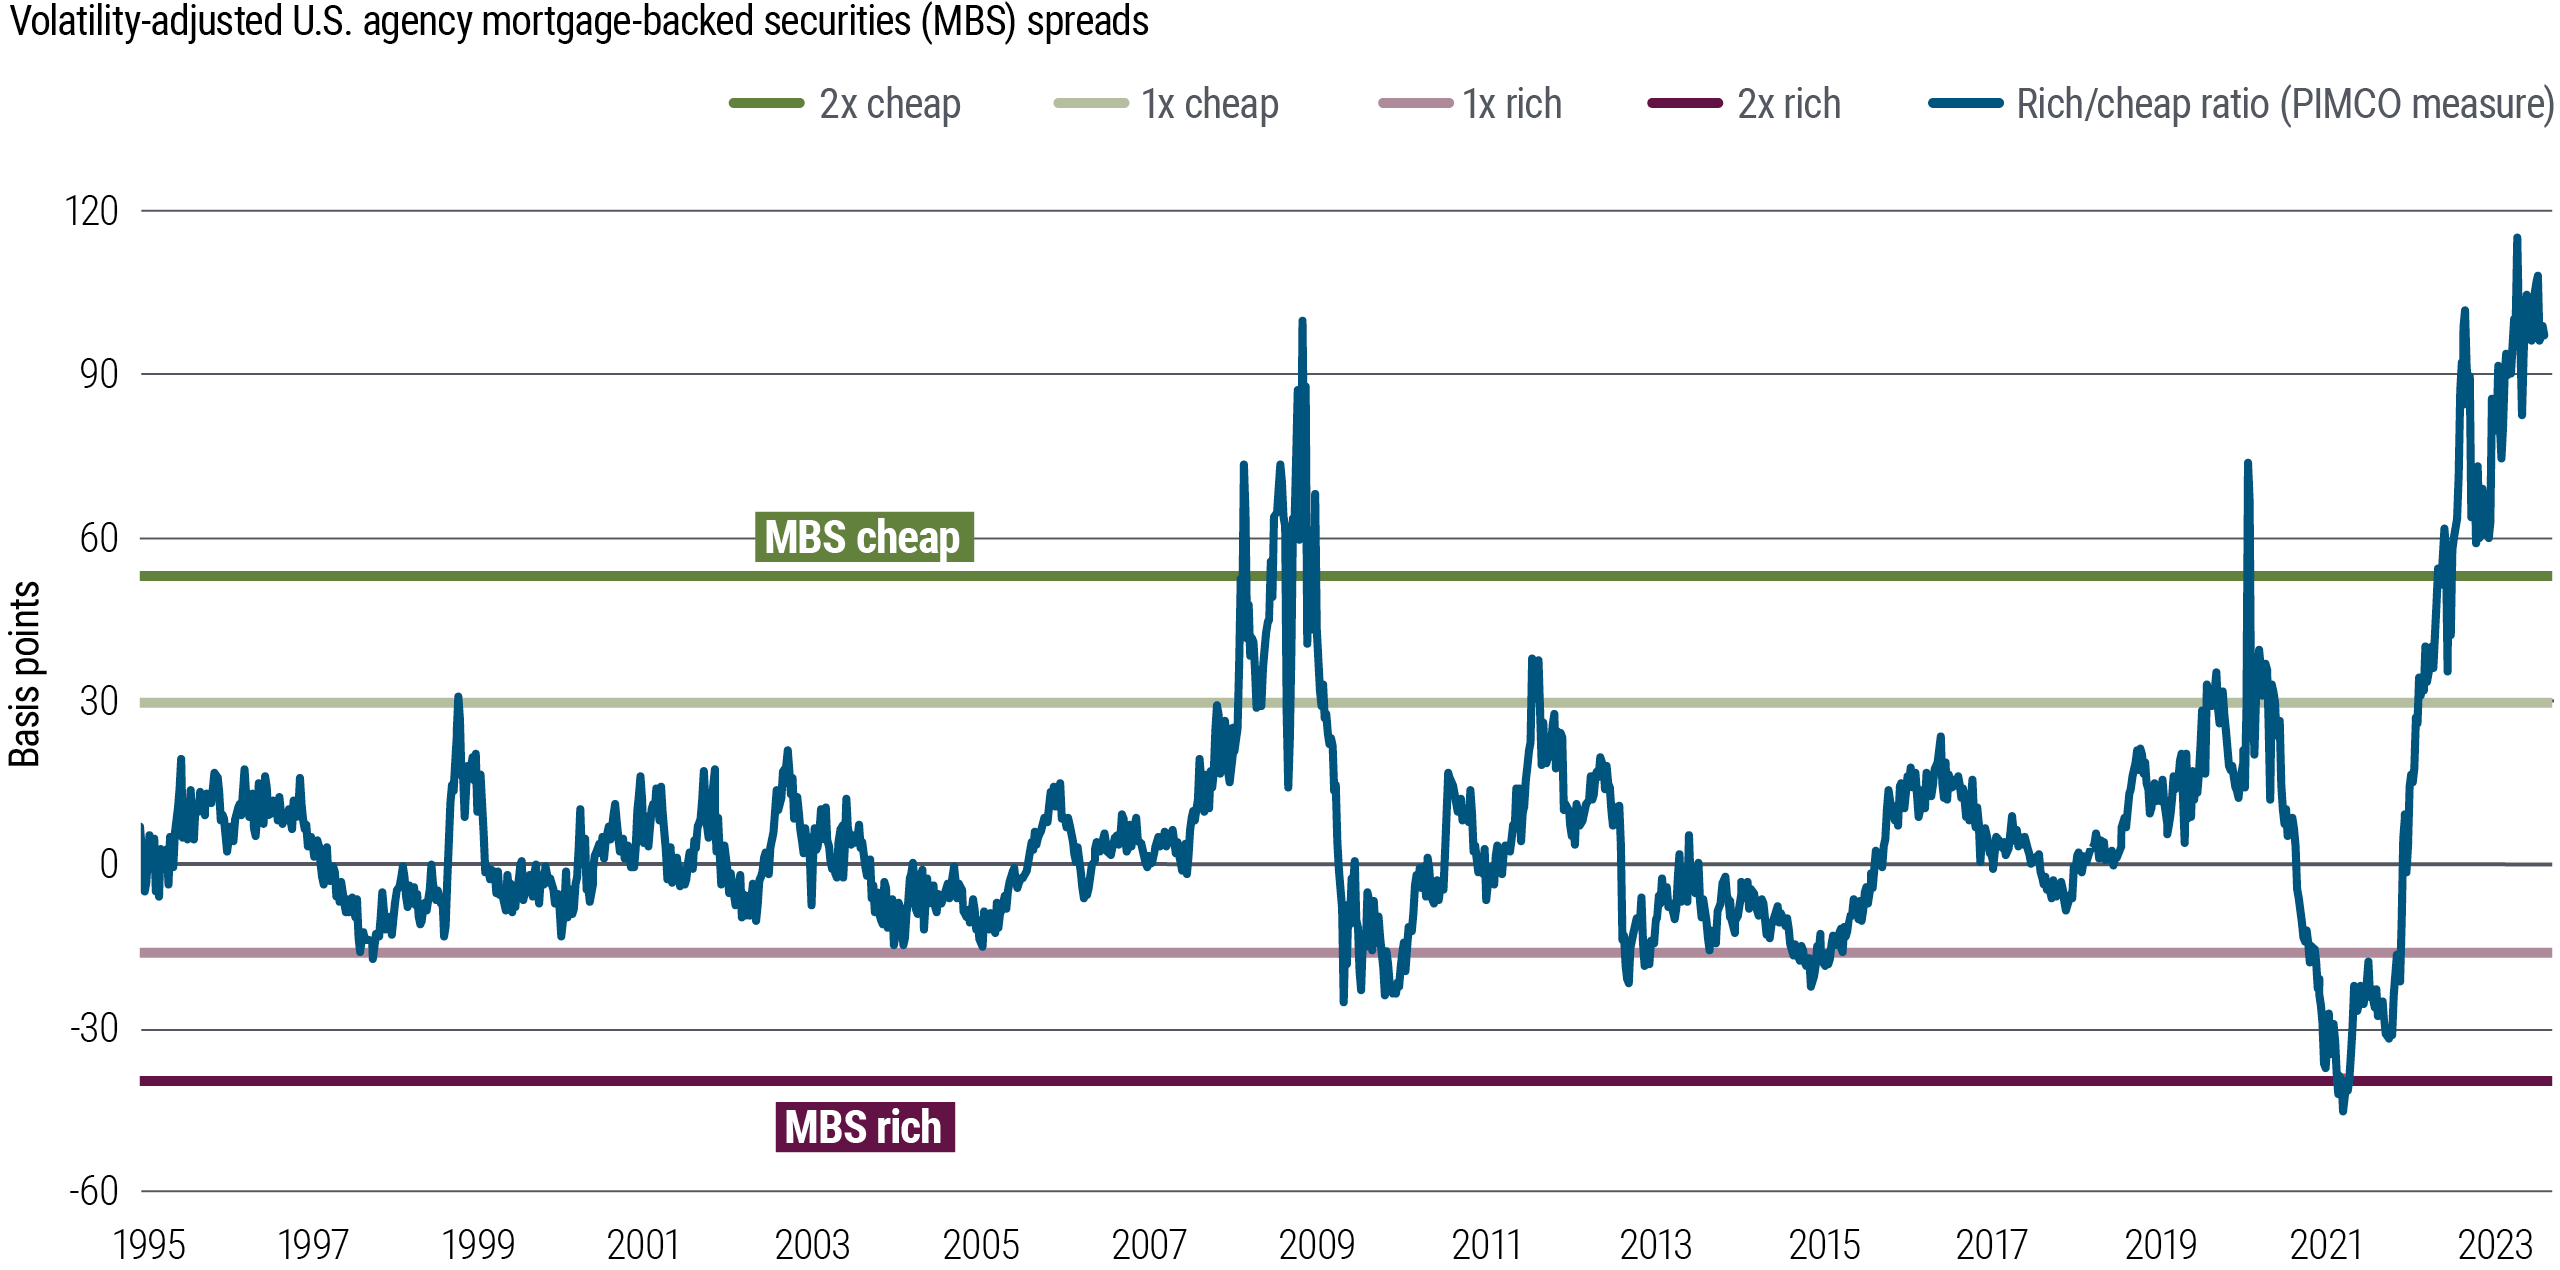
In contrast to corporate credit, attractive spreads can be found in mortgages and securitized bonds. We have a high allocation to U.S. agency mortgage-backed securities (MBS), which are high quality, liquid, and trading at very attractive valuations – see Figure 6. We also see value in senior positions of certain securitized assets such as collateralized loan obligations (CLOs) and collateralized mortgage obligations (CMOs).
Key takeaway
Looking across asset classes, we believe bonds stand out for their strong prospects in the baseline macro outlook as well as for their resilience, diversification, and especially valuation. Given the risks to an expensive equity market, the case for an allocation to high quality fixed income is compelling.
Download our investor handout for details on how we are positioning portfolios across global asset classes.
Download a PDF version of PIMCO’s Asset Allocation Outlook.

