Canadian Housing: Expensive, But Not Bubbly
Just over a year ago, the biggest prevailing worry in the Canadian financial system was the risk of house prices falling in the aftermath of the COVID-19 pandemic. Now, a year and more than 25% in gains later, investors are again asking: Are we in a bubble?
We have come full circle, as some investors worry about the potential for falling home prices to destabilize the economy. To determine the merit in these concerns, we value the housing market using a longer-term perspective, dissecting the secular drivers of house prices, and evaluating Canada’s market against other developed economies. Here are our key takeaways:
- Much of the secular appreciation in Canadian house prices over the last 30 years can be explained by lower discount rates, growth in incomes, and rent inflation.
- Controlling for these, Canadian house prices are moderately expensive versus certain other markets – notably the U.S. – but not quite in a bubble. Much of the overvaluation is found in the Greater Toronto (GTA) and Greater Vancouver (GVA) areas, where prices reflect local supply-demand factors.
- Long-term trends, particularly steady immigration, will likely increase housing demand, warranting a push to build more.
- Consumers have been the primary beneficiaries of housing price gains, owning 76% of the equity in the real estate market.
- Still, the extent of consumer wealth tied to housing, and high household leverage – especially for more recent buyers – implies that the economy remains vulnerable to a slowdown in housing and a sharp rise in interest rates.
- Overall, we expect prices to consolidate, but not fall precipitously. We are more constructive on housing in the U.S., where we see potential for further gains.
A long-term perspective
While a lot has been said about the sharp rise in prices since the pandemic began, it is important with long-lived assets such as housing to analyze price changes in a longer-term context – both against a cross section of other developed markets, as well as against secular factors that have changed materially over the years. The relevant drivers of housing prices are i) interest rates, ii) income growth and iii) inflation.
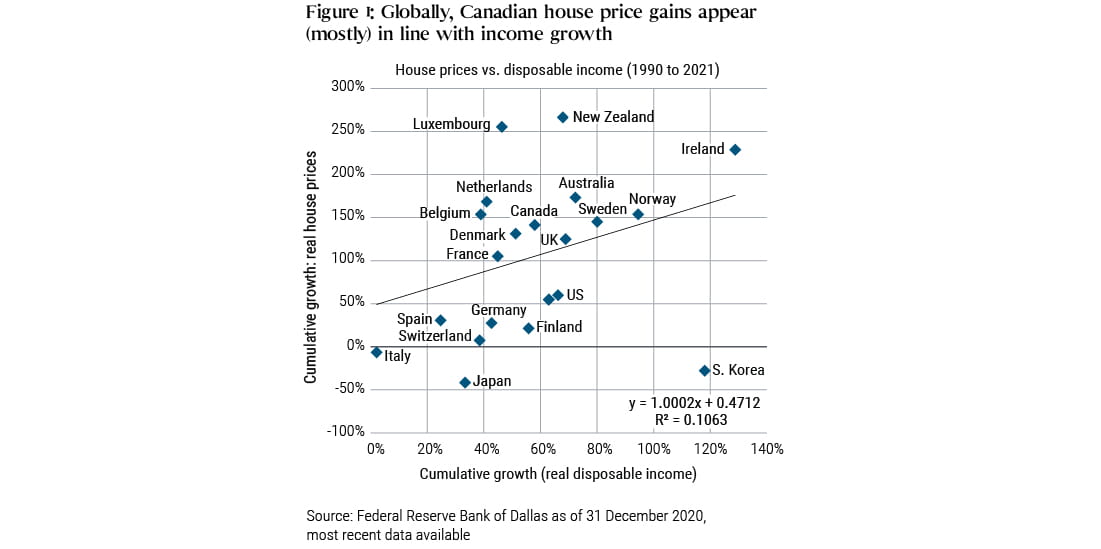
Let’s start with the performance of Canadian house prices relative to developed markets over the long run. Figure 1 shows cumulative house price gains over the last 30 years for nations in the Organisation for Economic Cooperation and Development (OECD). Prices are in real terms, normalized for inflation. We further normalize these results by plotting house prices against changes in real incomes across these countries to measure how much “affordability” has changed. This shows that while Canadian house prices have clearly appreciated more than certain countries, particularly the U.S., they don’t stand out versus a cohort of smaller open economies that have seen similar income gains. In fact, the U.K., Australia, Netherlands and France all show performance similar to that of Canada (as of the beginning of 2021).

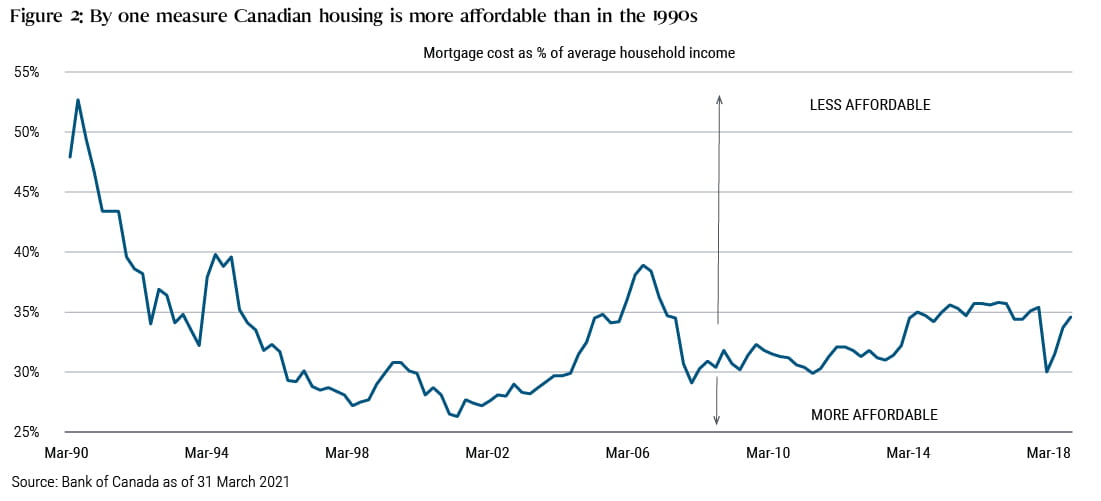
But this cross sectional analysis only tells part of the story; it doesn’t account for the impact of interest rates, which are a powerful driver of house prices. To examine this we take a look at house price affordability through another lens: exactly what percentage of the average income does it cost to own an average house in Canada (see Figure 2).
Since 1990, the average house has increased in price by a multiple of roughly four, from $160,000 Canadian dollars (CAD) to around $700,000 CAD. But during this time, average household incomes have increased as well, and financing rates have fallen from close to 10% to roughly 2% - 2.5%. When all is accounted for, we find that carrying costs, adjusting for a 20% down payment, at nearly 35% of household income, are certainly higher than they were in the early 2000s, when they bottomed close to 25% -- but a lot lower than the early ‘90s, for instance. And this is only for new home buyers – the vast majority of homeowners have locked in prices that are much lower and progressively benefitted from falling rates, so their outlay is likely much smaller.

This longer term perspective on the Canadian housing market suggests that most of the move is explained by fundamentals. The price gains seen since the start of the pandemic are not limited to Canada, nor to housing.
Still, Canada has outperformed the U.S. in aggregate over 30 years, with pockets of the Canadian market – particularly the GTA and GVA – where we find abnormal price growth, even accounting for secular factors.
Local supply-demand imbalances
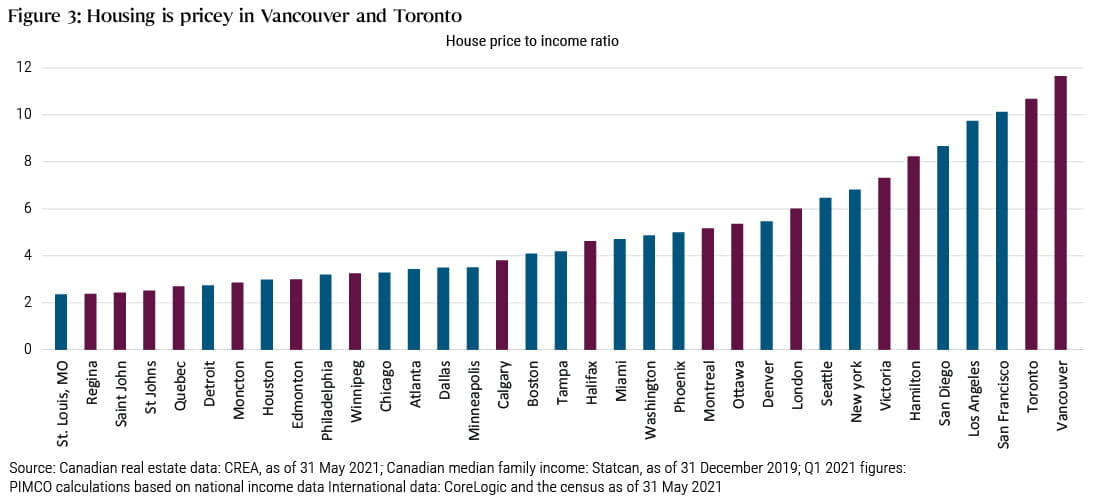
To see how key Canadian cities currently compare to their southern neighbors, we look at median house prices adjusted for family income across a broad swath of Canadian and U.S. cities, based on May 2021 house price data (see Figure 3). While Toronto and Vancouver clearly stand out at the high end with median homes costing 11-12 times median income, most Canadian cities measure reasonably versus their U.S. peers, with low interest rates making several cities in the Prairies and Atlantic Canada still affordable relative to income.
In our view, high prices in the large cities stem from a demand-supply imbalance, caused by several factors including net immigration, non-resident ownership, land scarcity, zoning restrictions, and permitting red tape. While hard to disentangle cause and effect, we see similar trends in select global cities that share the same socio-economic trends (e.g., San Francisco). These factors can largely only be addressed by supply-side solutions. Unfortunately for Canada, these two cities represent a material share of the overall housing stock, hastening the imperative for solutions, whereas in the U.S. similar cities are only a small portion of the market.

Economic implications
Who are the key beneficiaries of a strong housing market? Canadians owed 1.7 trillion CAD in mortgage debt against a $7.2 trillion CAD collective value of their homes.Footnote1 This puts owner’s equity at 76% – not surprising given rising prices. With a homeownership rate close to 70%, Canadians have participated to varying degrees in the gains, and are experiencing the wealth effects across their lives. Still, rapidly rising prices, particularly in the GTA and GVA areas, are putting homeownership out of reach for many younger aspirants, and may be burdening other recent borrowers who have stretched their budgets to secure homes. Clearly, more supply is needed to help address some of these gaps.
Yet the wealth effect works both ways. The Canadian economy remains very levered to both the price of housing and the price of mortgage credit. In general, Canadian consumers are more leveraged than their southern neighbors, carrying almost twice the debt relative to income. Just as a positive wealth effect has boosted the economy in past years, a fall in house prices could cause a negative wealth effect, shrinking the economy, especially if it were not offset by greater fiscal spending. Indeed, a drop in home prices, while unlikely to cause cascading foreclosures and failing financial institutions, could lead consumers to curtail discretionary spending. Both the government and the Bank of Canada must be wary of risks stemming from household leverage.
In addition, the effects of interest rate changes are now likely to be magnified. Unlike the U.S., where the 30-year fixed product dominates, interest rate terms for most Canadian mortgages are much shorter, usually five years or less, so rate increases pass through to housing outlays much quicker, thus eating into other aspects of consumption. This sensitivity implies that interest rate policy changes must follow income growth, and therefore, may need to be slower.
Lastly, while further gains in Canadian housing are possible, we view a period of consolidation as more likely, especially as supply catches up with demand during a phase of lower immigration, and as tightening macro prudential regulations and underwriting changes limit borrowing capacity to fuel further gains.
Featured Participants
Disclosures
Statements concerning financial market trends or portfolio strategies are based on current market conditions, which will fluctuate. There is no guarantee that these investment strategies will work under all market conditions or are appropriate for all investors and each investor should evaluate their ability to invest for the long term, especially during periods of downturn in the market. Outlook and strategies are subject to change without notice
This material contains the current opinions of the author and such opinions are subject to change without notice. This material is distributed for informational purposes only and should not be considered as investment advice or a recommendation of any particular security, strategy or investment product. Information contained herein has been obtained from sources believed to be reliable, but not guaranteed.
PIMCO as a general matter provides services to qualified institutions, financial intermediaries and institutional investors. Individual investors should contact their own financial professional to determine the most appropriate investment options for their financial situation. This is not an offer to any person in any jurisdiction where unlawful or unauthorized. | Pacific Investment Management Company LLC, 650 Newport Center Drive, Newport Beach, CA 92660 is regulated by the United States Securities and Exchange Commission. | PIMCO Europe Ltd (Company No. 2604517) is authorised and regulated by the Financial Conduct Authority (12 Endeavour Square, London E20 1JN) in the UK. The services provided by PIMCO Europe Ltd are not available to retail investors, who should not rely on this communication but contact their financial adviser. | PIMCO Europe GmbH (Company No. 192083, Seidlstr. 24-24a, 80335 Munich, Germany), PIMCO Europe GmbH Italian Branch (Company No. 10005170963), PIMCO Europe GmbH Irish Branch (Company No. 909462), PIMCO Europe GmbH UK Branch (Company No. BR022803) and PIMCO Europe GmbH Spanish Branch (N.I.F. W2765338E) are authorised and regulated by the German Federal Financial Supervisory Authority (BaFin) (Marie- Curie-Str. 24-28, 60439 Frankfurt am Main) in Germany in accordance with Section 32 of the German Banking Act (KWG). The Italian Branch, Irish Branch, UK Branch and Spanish Branch are additionally supervised by: (1) Italian Branch: the Commissione Nazionale per le Società e la Borsa (CONSOB) in accordance with Article 27 of the Italian Consolidated Financial Act; (2) Irish Branch: the Central Bank of Ireland in accordance with Regulation 43 of the European Union (Markets in Financial Instruments) Regulations 2017, as amended; (3) UK Branch: the Financial Conduct Authority; and (4) Spanish Branch: the Comisión Nacional del Mercado de Valores (CNMV) in accordance with obligations stipulated in articles 168 and 203 to 224, as well as obligations contained in Tile V, Section I of the Law on the Securities Market (LSM) and in articles 111, 114 and 117 of Royal Decree 217/2008, respectively. The services provided by PIMCO Europe GmbH are available only to professional clients as defined in Section 67 para. 2 German Securities Trading Act (WpHG). They are not available to individual investors, who should not rely on this communication. | PIMCO (Schweiz) GmbH (registered in Switzerland, Company No. CH-020.4.038.582-2). The services provided by PIMCO (Schweiz) GmbH are not available to retail investors, who should not rely on this communication but contact their financial adviser. | PIMCO Asia Pte Ltd (Registration No. 199804652K) is regulated by the Monetary Authority of Singapore as a holder of a capital markets services licence and an exempt financial adviser. The asset management services and investment products are not available to persons where provision of such services and products is unauthorised. | PIMCO Asia Limited is licensed by the Securities and Futures Commission for Types 1, 4 and 9 regulated activities under the Securities and Futures Ordinance. PIMCO Asia Limited is registered as a cross-border discretionary investment manager with the Financial Supervisory Commission of Korea (Registration No. 08-02-307). The asset management services and investment products are not available to persons where provision of such services and products is unauthorised. | PIMCO Investment Management (Shanghai) Limited Unit 3638-39, Phase II Shanghai IFC, 8 Century Avenue, Pilot Free Trade Zone, Shanghai, 200120, China (Unified social credit code: 91310115MA1K41MU72) is registered with Asset Management Association of China as Private Fund Manager (Registration No. P1071502, Type: Other) | PIMCO Australia Pty Ltd ABN 54 084 280 508, AFSL 246862. This publication has been prepared without taking into account the objectives, financial situation or needs of investors. Before making an investment decision, investors should obtain professional advice and consider whether the information contained herein is appropriate having regard to their objectives, financial situation and needs. | PIMCO Japan Ltd, Financial Instruments Business Registration Number is Director of Kanto Local Finance Bureau (Financial Instruments Firm) No. 382. PIMCO Japan Ltd is a member of Japan Investment Advisers Association and The Investment Trusts Association, Japan. All investments contain risk. There is no guarantee that the principal amount of the investment will be preserved, or that a certain return will be realized; the investment could suffer a loss. All profits and losses incur to the investor. The amounts, maximum amounts and calculation methodologies of each type of fee and expense and their total amounts will vary depending on the investment strategy, the status of investment performance, period of management and outstanding balance of assets and thus such fees and expenses cannot be set forth herein. | PIMCO Taiwan Limited is managed and operated independently. The reference number of business license of the company approved by the competent authority is (109) Jin Guan Tou Gu Xin Zi No. 027. 40F., No.68, Sec. 5, Zhongxiao E. Rd., Xinyi Dist., Taipei City 110, Taiwan (R.O.C.). Tel: +886 2 8729-5500. | PIMCO Canada Corp. (199 Bay Street, Suite 2050, Commerce Court Station, P.O. Box 363, Toronto, ON, M5L 1G2) services and products may only be available in certain provinces or territories of Canada and only through dealers authorized for that purpose. | PIMCO Latin America Av. Brigadeiro Faria Lima 3477, Torre A, 5° andar São Paulo, Brazil 04538-133. | No part of this publication may be reproduced in any form, or referred to in any other publication, without express written permission. PIMCO is a trademark of Allianz Asset Management of America L.P. in the United States and throughout the world. ©2021, PIMCO.
CMR2021-0817-1763522
