There’s a gauge in the bond market that’s important to understand yet difficult to calculate and impossible to observe. It can help investors figure out how much they are getting paid for the risk of holding bonds over a longer time period. It can also inform officials as they set a course for monetary policy.
At its May 2023 Secular Forum, PIMCO concluded that “with rising government debt, we expect the yield curve to steepen as investors demand more compensation from bonds” over the coming years (for more, see our Secular Outlook, “The Aftershock Economy”). We will be revisiting this topic along with many others at our 2024 Secular Forum this week.
This compensation – the term premium – is the expected excess return that investors earn by holding longer-dated U.S. Treasuries versus rolling over T-bills. (Term premium can apply to any sovereign bond issue, but this note will focus on the U.S.) Historically, the term premium has been positive. The intuition is that because the volatility of returns over any given holding period on a long-duration bond is much greater than the volatility of returns on a T-bill investment over the same holding period, investors expect to earn compensation for taking on that risk.
A higher term premium bodes well for investors in the long run. In the near term, it helps investors determine which bond maturities offer the best value while minimizing both interest rate (duration) risk and reinvestment risk. As discussed in a recent essay by my colleagues Marc Seidner and Pramol Dhawan, factors other than the stock of Treasuries outstanding can also influence the equilibrium term premium (for more, see our PIMCO Perspectives, “Term Premium Poised to Rise Again, With Widespread Asset Price Implications”).
The Treasury term premium is important not only to bond investors, but also to the Federal Reserve. Last fall, when Treasury yields rose sharply, concerns about the U.S. fiscal trajectory and political dysfunction were seen as an important driver. The Fed itself said an increase in the term premium contributed to the sell-off,Footnote1 and cited in its 1 November 2023 policy statement the resulting tightening in financial conditions as one reason to keep rates on hold at that meeting.
While understanding the term premium is important, the term premium itself is unobservable. In this essay we discuss how estimates of the term premium are constructed, how to interpret them, and how they are tied to expectations about monetary policy. Although these methodologies differ when it comes to details, they all appear to indicate a recent rise in investor compensation. Looking ahead, a key question is whether it will rise more.
Compensation calculation
The term premium on a 10-year Treasury can be written as follows:
Term premium = Yield on 10-year Treasury − Average of expected T-bill yields over next 10 years
While the yield today on a 10-year Treasury note is of course observable, the average of expected T-bill yields over the next 10 years is not. Thus, to estimate the term premium at a point in time, one has to estimate or somehow proxy the average of expected T-bill yields over the next 10 years at that point in time. Since T-bill yields and the federal funds rate are tightly linked via arbitrage in the money markets, the average of expected T-bill yields in the future amounts to estimating the path of the fed funds rate and thus monetary policy over the next 10 years.
There are several ways to proxy the average of expected T-bill yields over the next 10 years, but I will focus on two. The first is to estimate a statistical model of interest rates using historical data, then to use the model at each point in time to forecast T-bill yields over the next 10 years and calculate the average. The ACM (Adrian, Crump, Moench) model maintained by the New York Fed and the CR (Christensen and Rudebusch) model maintained by the San Fransisco Fed both use this approach.
The second way to estimate T-bill yields is to dispense with statistical models and instead survey investors for their average estimates of T-bill yields (or fed funds rates) over the next 10 years and take the median of the survey results. Two prominent surveys that can be used for this purpose are the Livingston Survey of Economists maintained by the Philadelphia Fed and the Survey of Primary Dealers and Market Participants maintained by the New York Fed.
On the rise
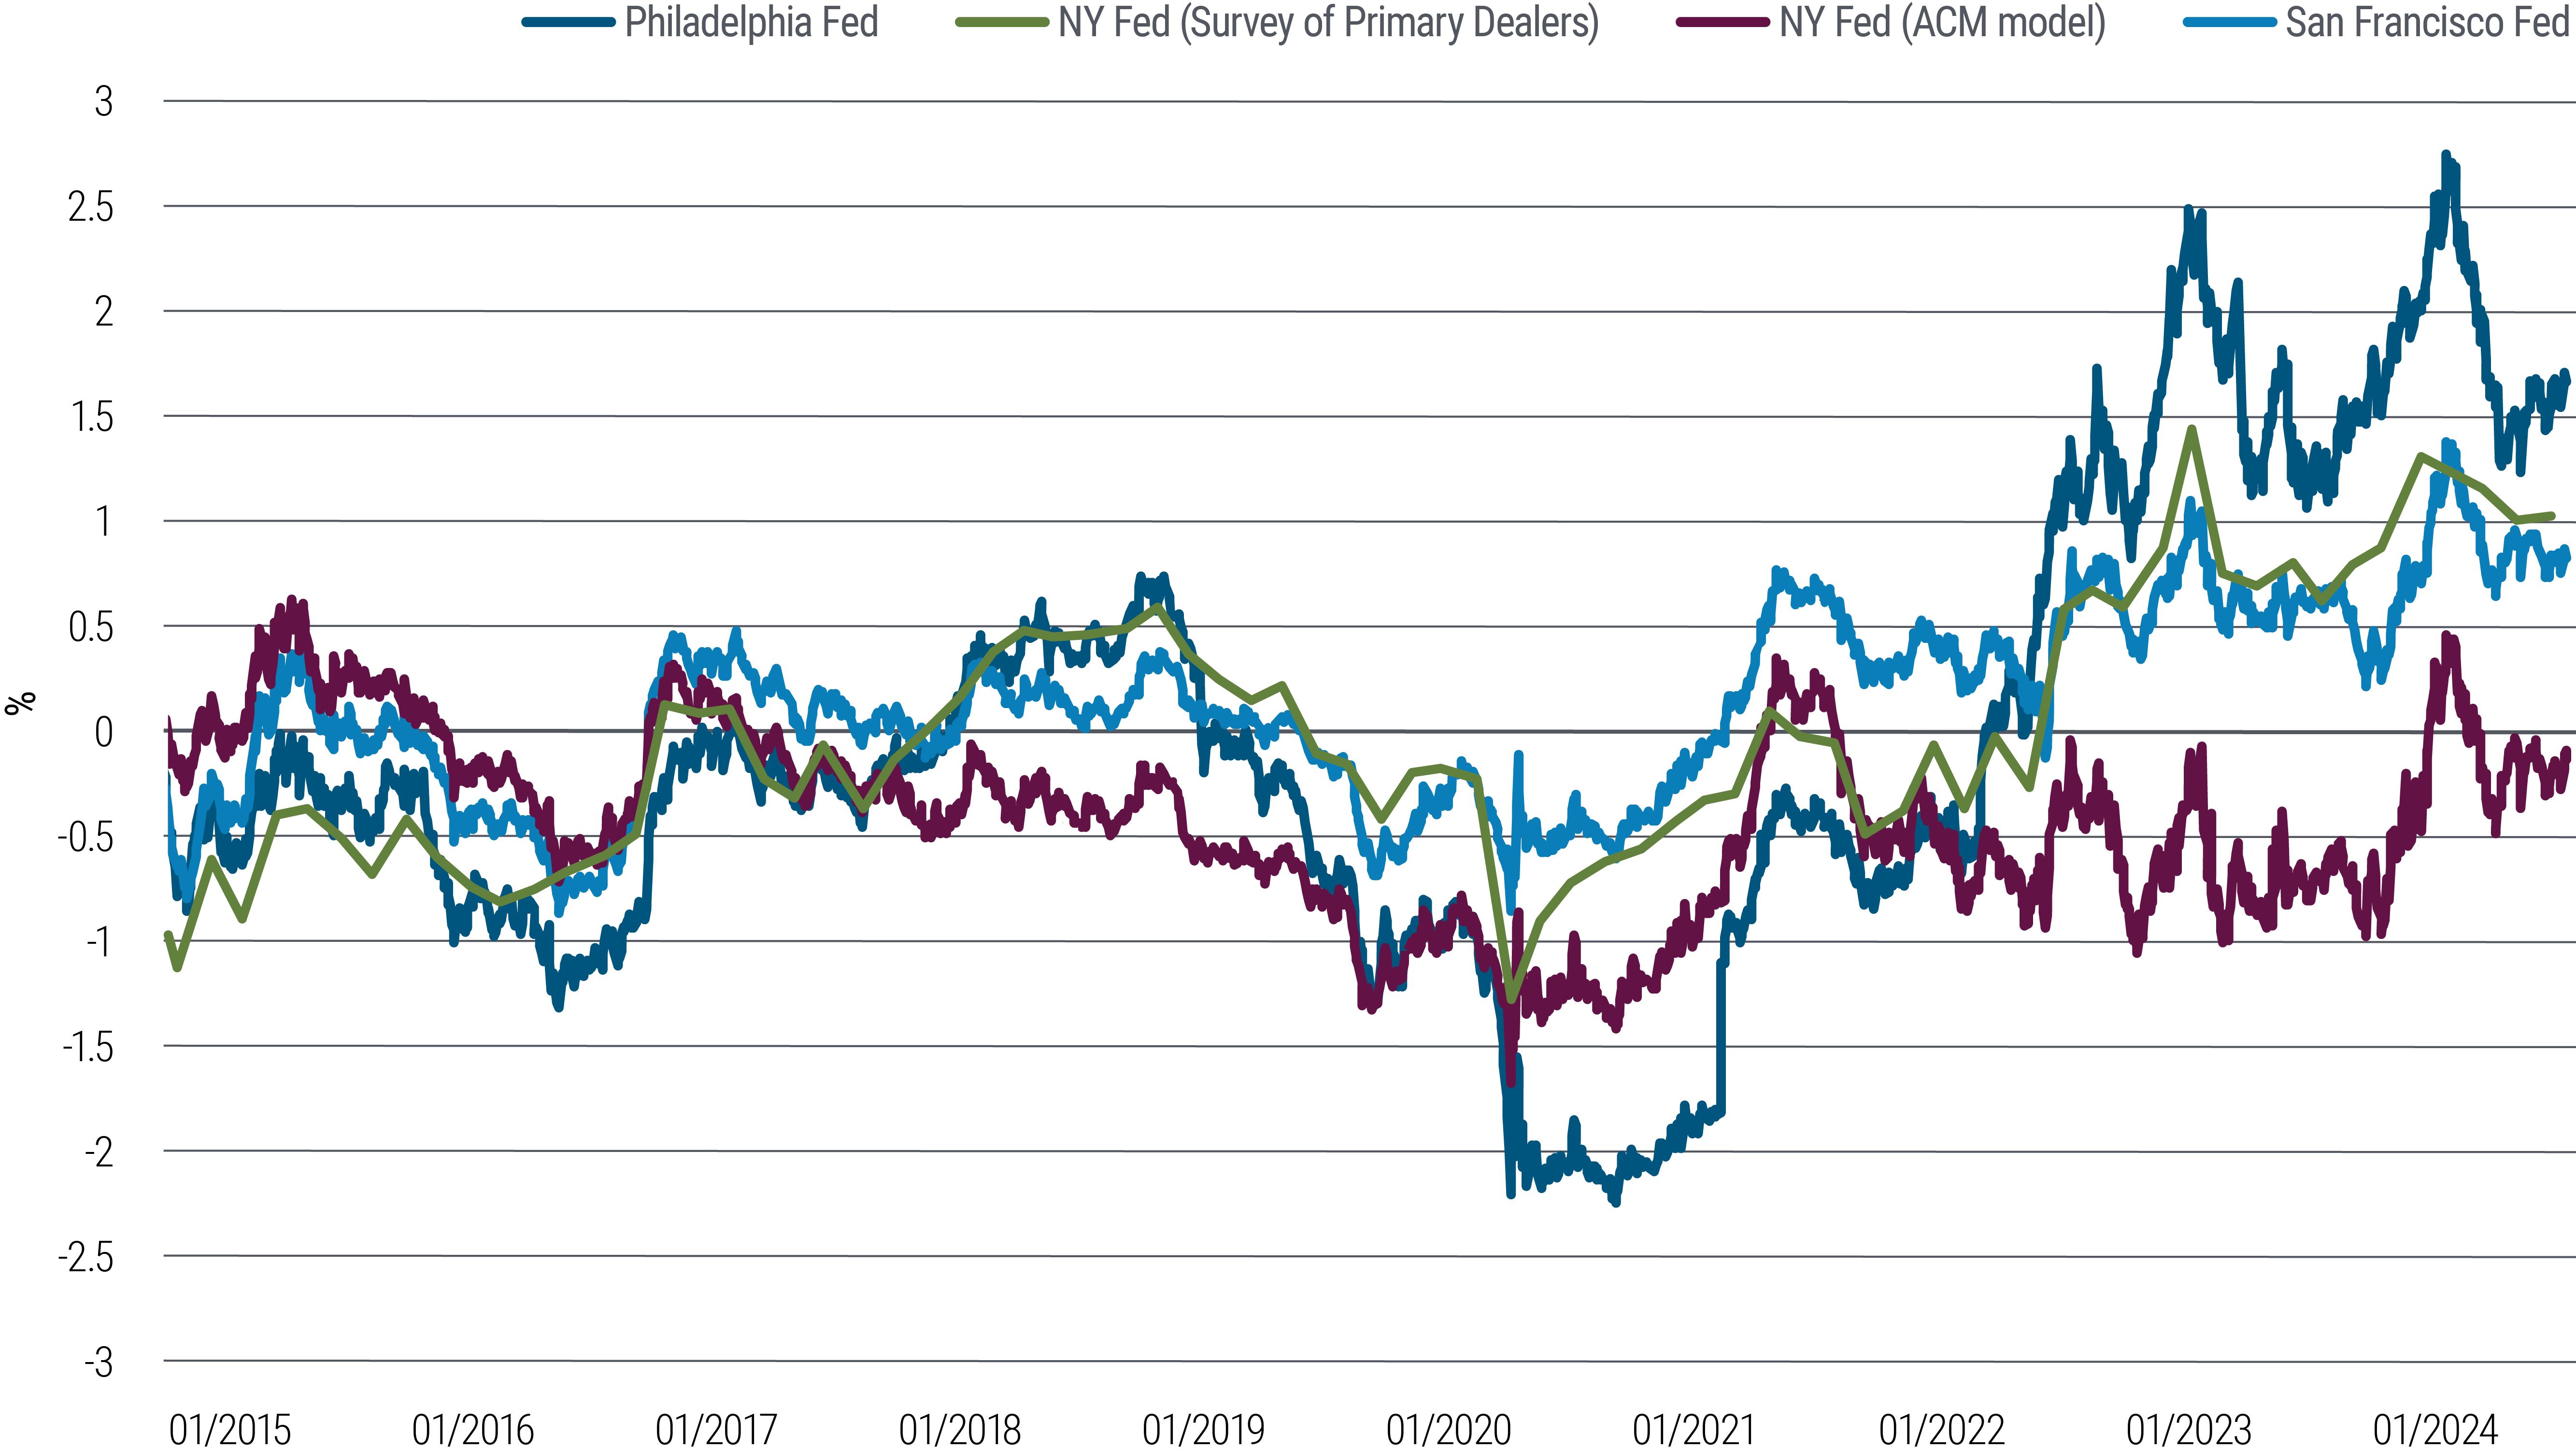
Figure 1 plots the estimated term premium since 2014 (when the primary dealer survey began to include the relevant question about expected average fed funds rate over the following 10 years) using all four methods for estimating T-bill yields, then subtracting those estimates from the observed yield on the 10-year Treasury.
Two things stand out. First, all four gauges tend to rise and fall together. In particular, all the estimates show a pronounced spike in the term premium in the summer and fall of 2023 during the “Treasury Tantrum,” when that market sold off sharply, with 10-year yields spiking from 3.35% to 4.99% between May and October.
Second, all four measures have increased substantially since 2019, and even more so since 2020 when central banks flooded their banking systems with liquidity to fund very large scale, open-ended quantitative easing (QE) purchases of much of the sovereign debt issued by their governments during the pandemic.
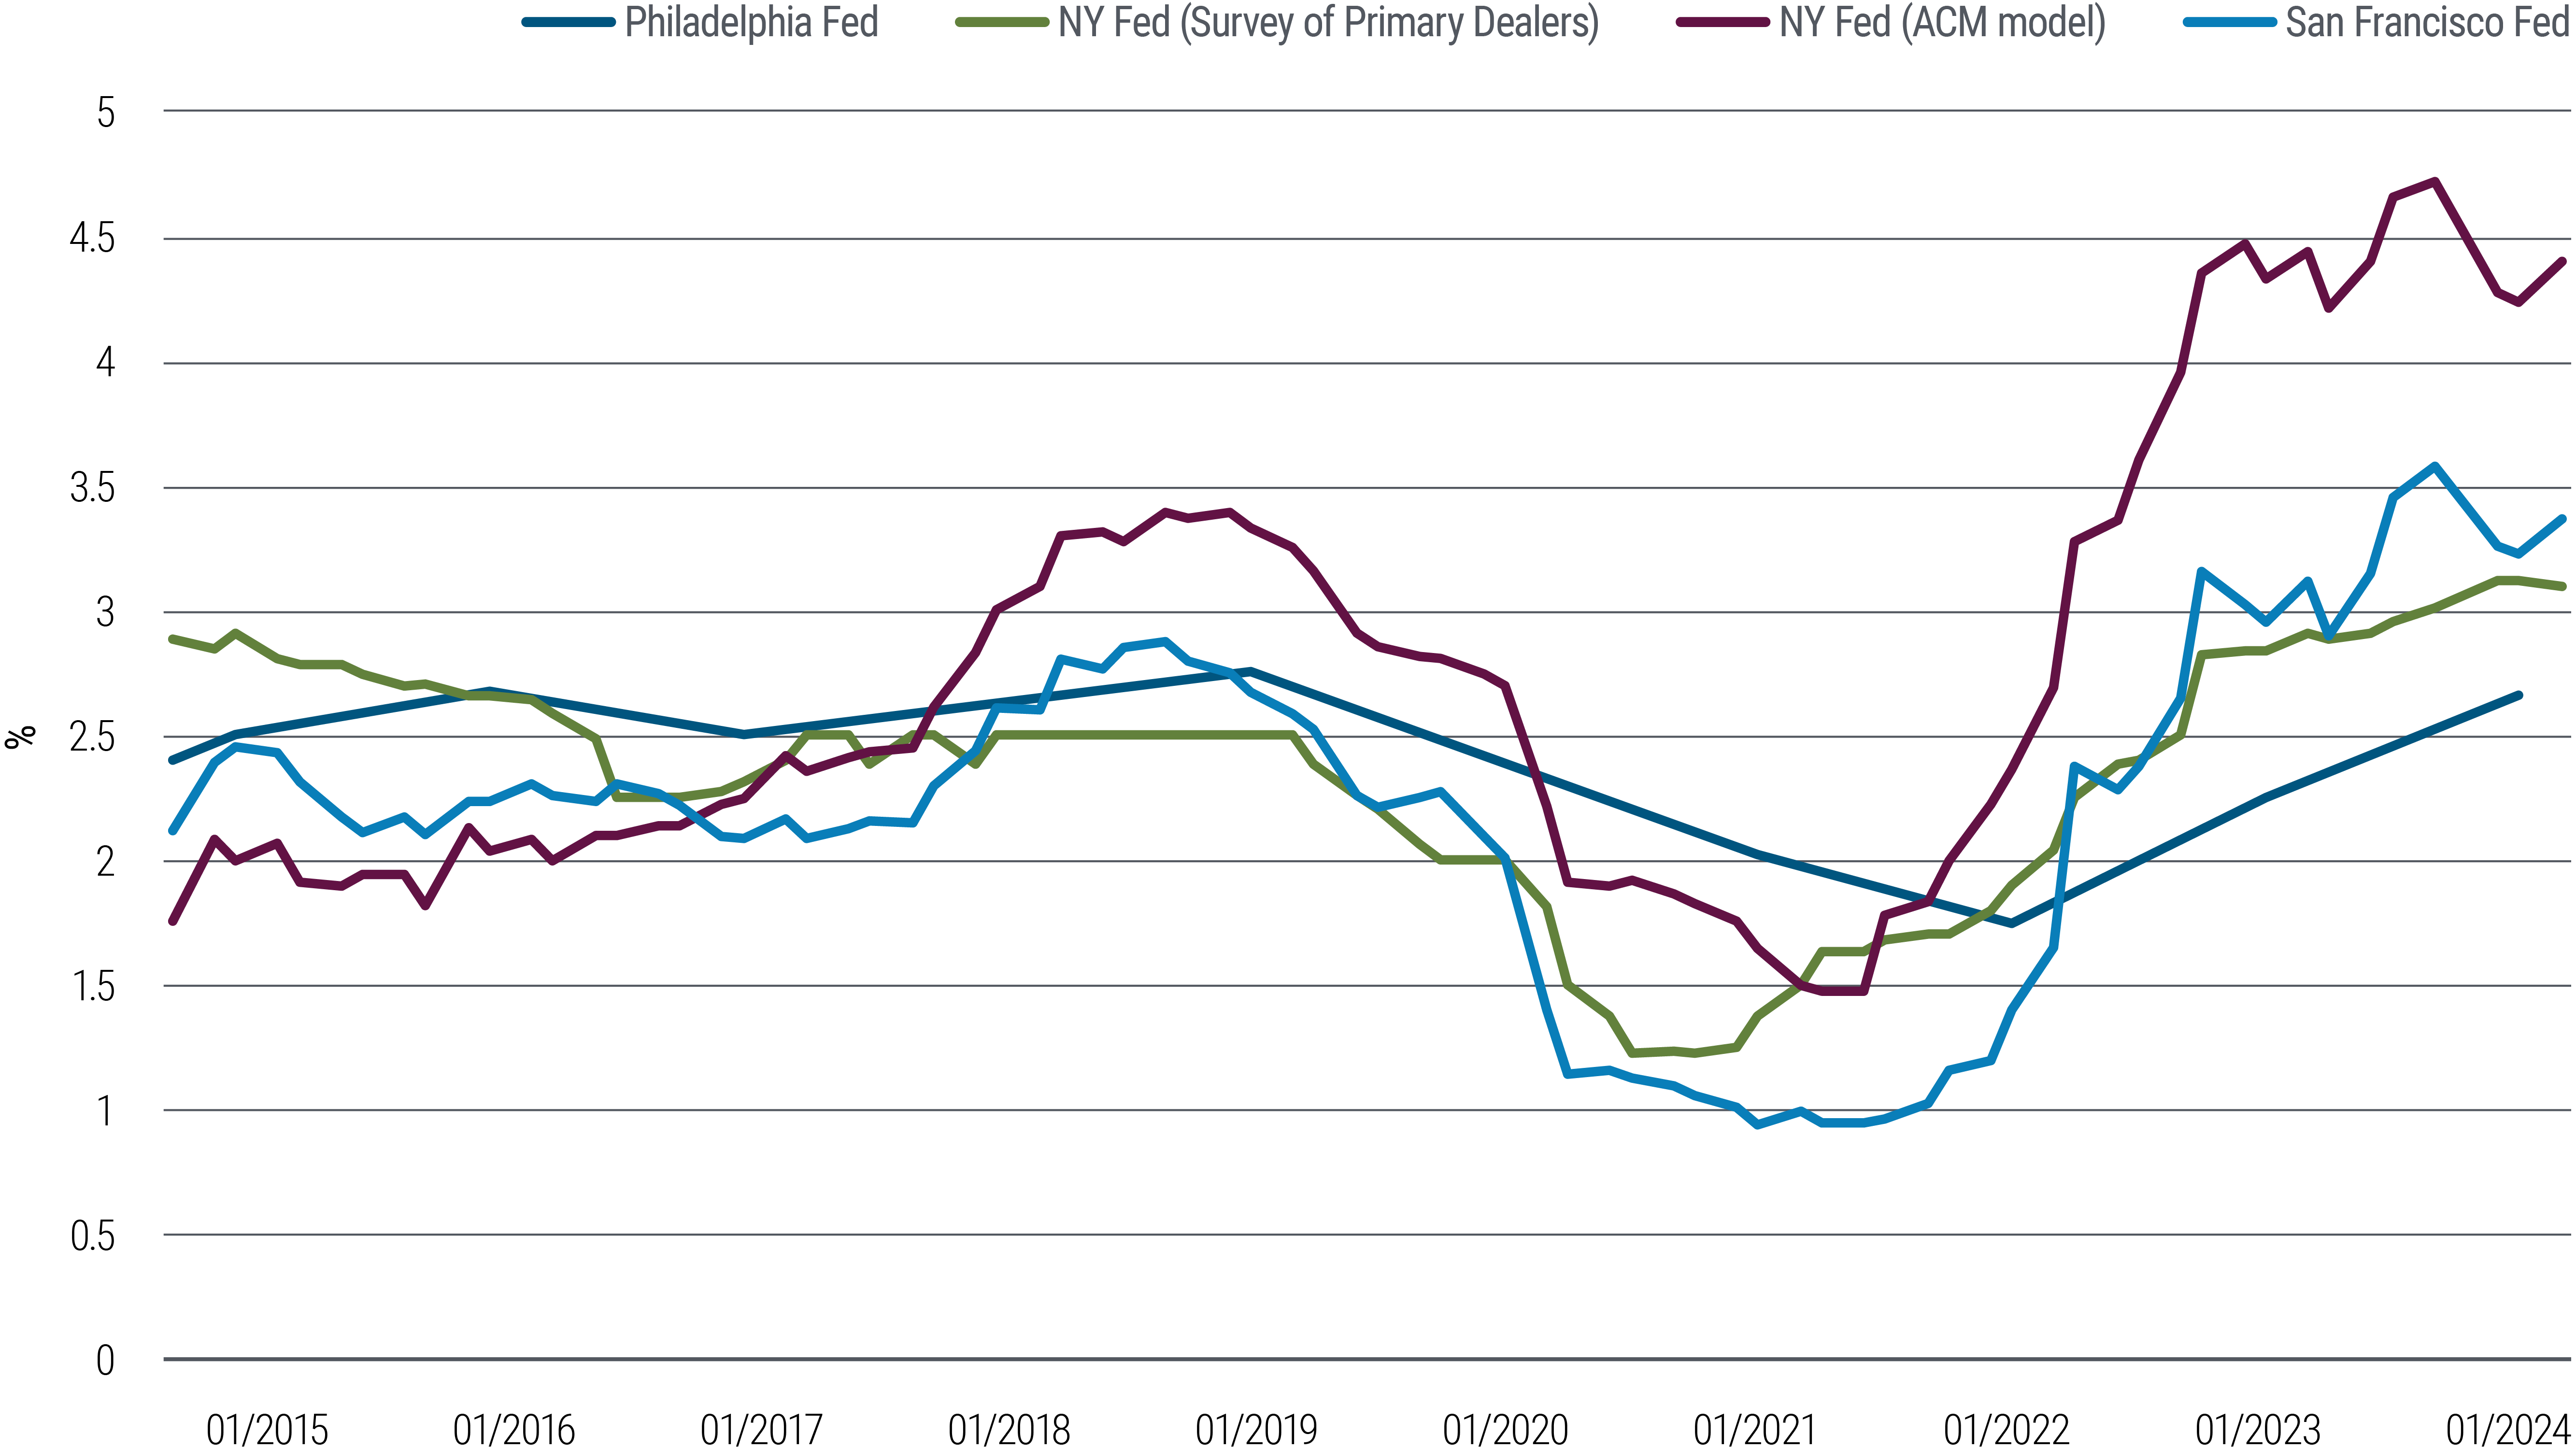
The differences in these measures stem from varying assumptions about the expected average fed funds rate over the next 10 years. Figure 2 illustrates the implied evolution of the average of expected T-bill yields and (by extension) implied fed funds rate estimates over the following 10 years for each of the four models.
The four measures sometimes vary considerably. For example, the most recent primary dealer survey dated 11 March 2024 estimates the fed funds rate over the next 10 years will average roughly 3.1%, while the ACM statistical model forecasts that T-bill yields (a proxy for the fed funds rate, as mentioned earlier) over the next 10 years will average 4.4%.
My own “New Neutral” view, which is consistent with the Fed’s most recent projections for the long-run median fed funds rate, is most aligned with the primary dealer survey and San Francisco Fed model estimates. Put another way, I believe that the longer-term neutral Fed policy rate is much lower than the current rate, whereas some term premium models assume very little decline in the policy rate.
Final takeaways
Investing comes down to assessing risk and the reward for taking on that risk. The term premium on a Treasury note is the reward for taking on duration risk. That expected reward in the decade before the pandemic was depressed. Although there’s no single definitive measure of the term premium, the four common models described above all agree on the recent upward direction, if not the precise extent of the rise. It paints a compelling picture for long-term investors.


