Leaving PIMCO.com

You are now leaving the PIMCO website.

Skip to Main Content
PM Chartbook

Charting Commodity Markets With Greg Sharenow

Greg Sharenow, managing director and portfolio manager, charts the continued resilience of commodities and their low correlation with stocks and bonds amid recent geopolitical shocks, underscoring their strength as portfolio diversifiers.

Risk premia in oil – transitory for now

In the weeks leading up to last month’s Israeli and U.S. strikes on Iran, oil prices climbed – not due to actual supply disruptions, but in response to a geopolitical risk premium. Fears of a potential closure of the Strait of Hormuz drove market anxiety, though those concerns ultimately didn’t materialize. Iran’s muted response helped ease tensions, and the risk premium quickly unwound.

That said, the situation remains fluid. Ongoing concerns about Iran’s uranium stockpiles – and the possibility of further Israeli action – mean the geopolitical backdrop remains a source of potential volatility.

Oil prices experienced significant volatility
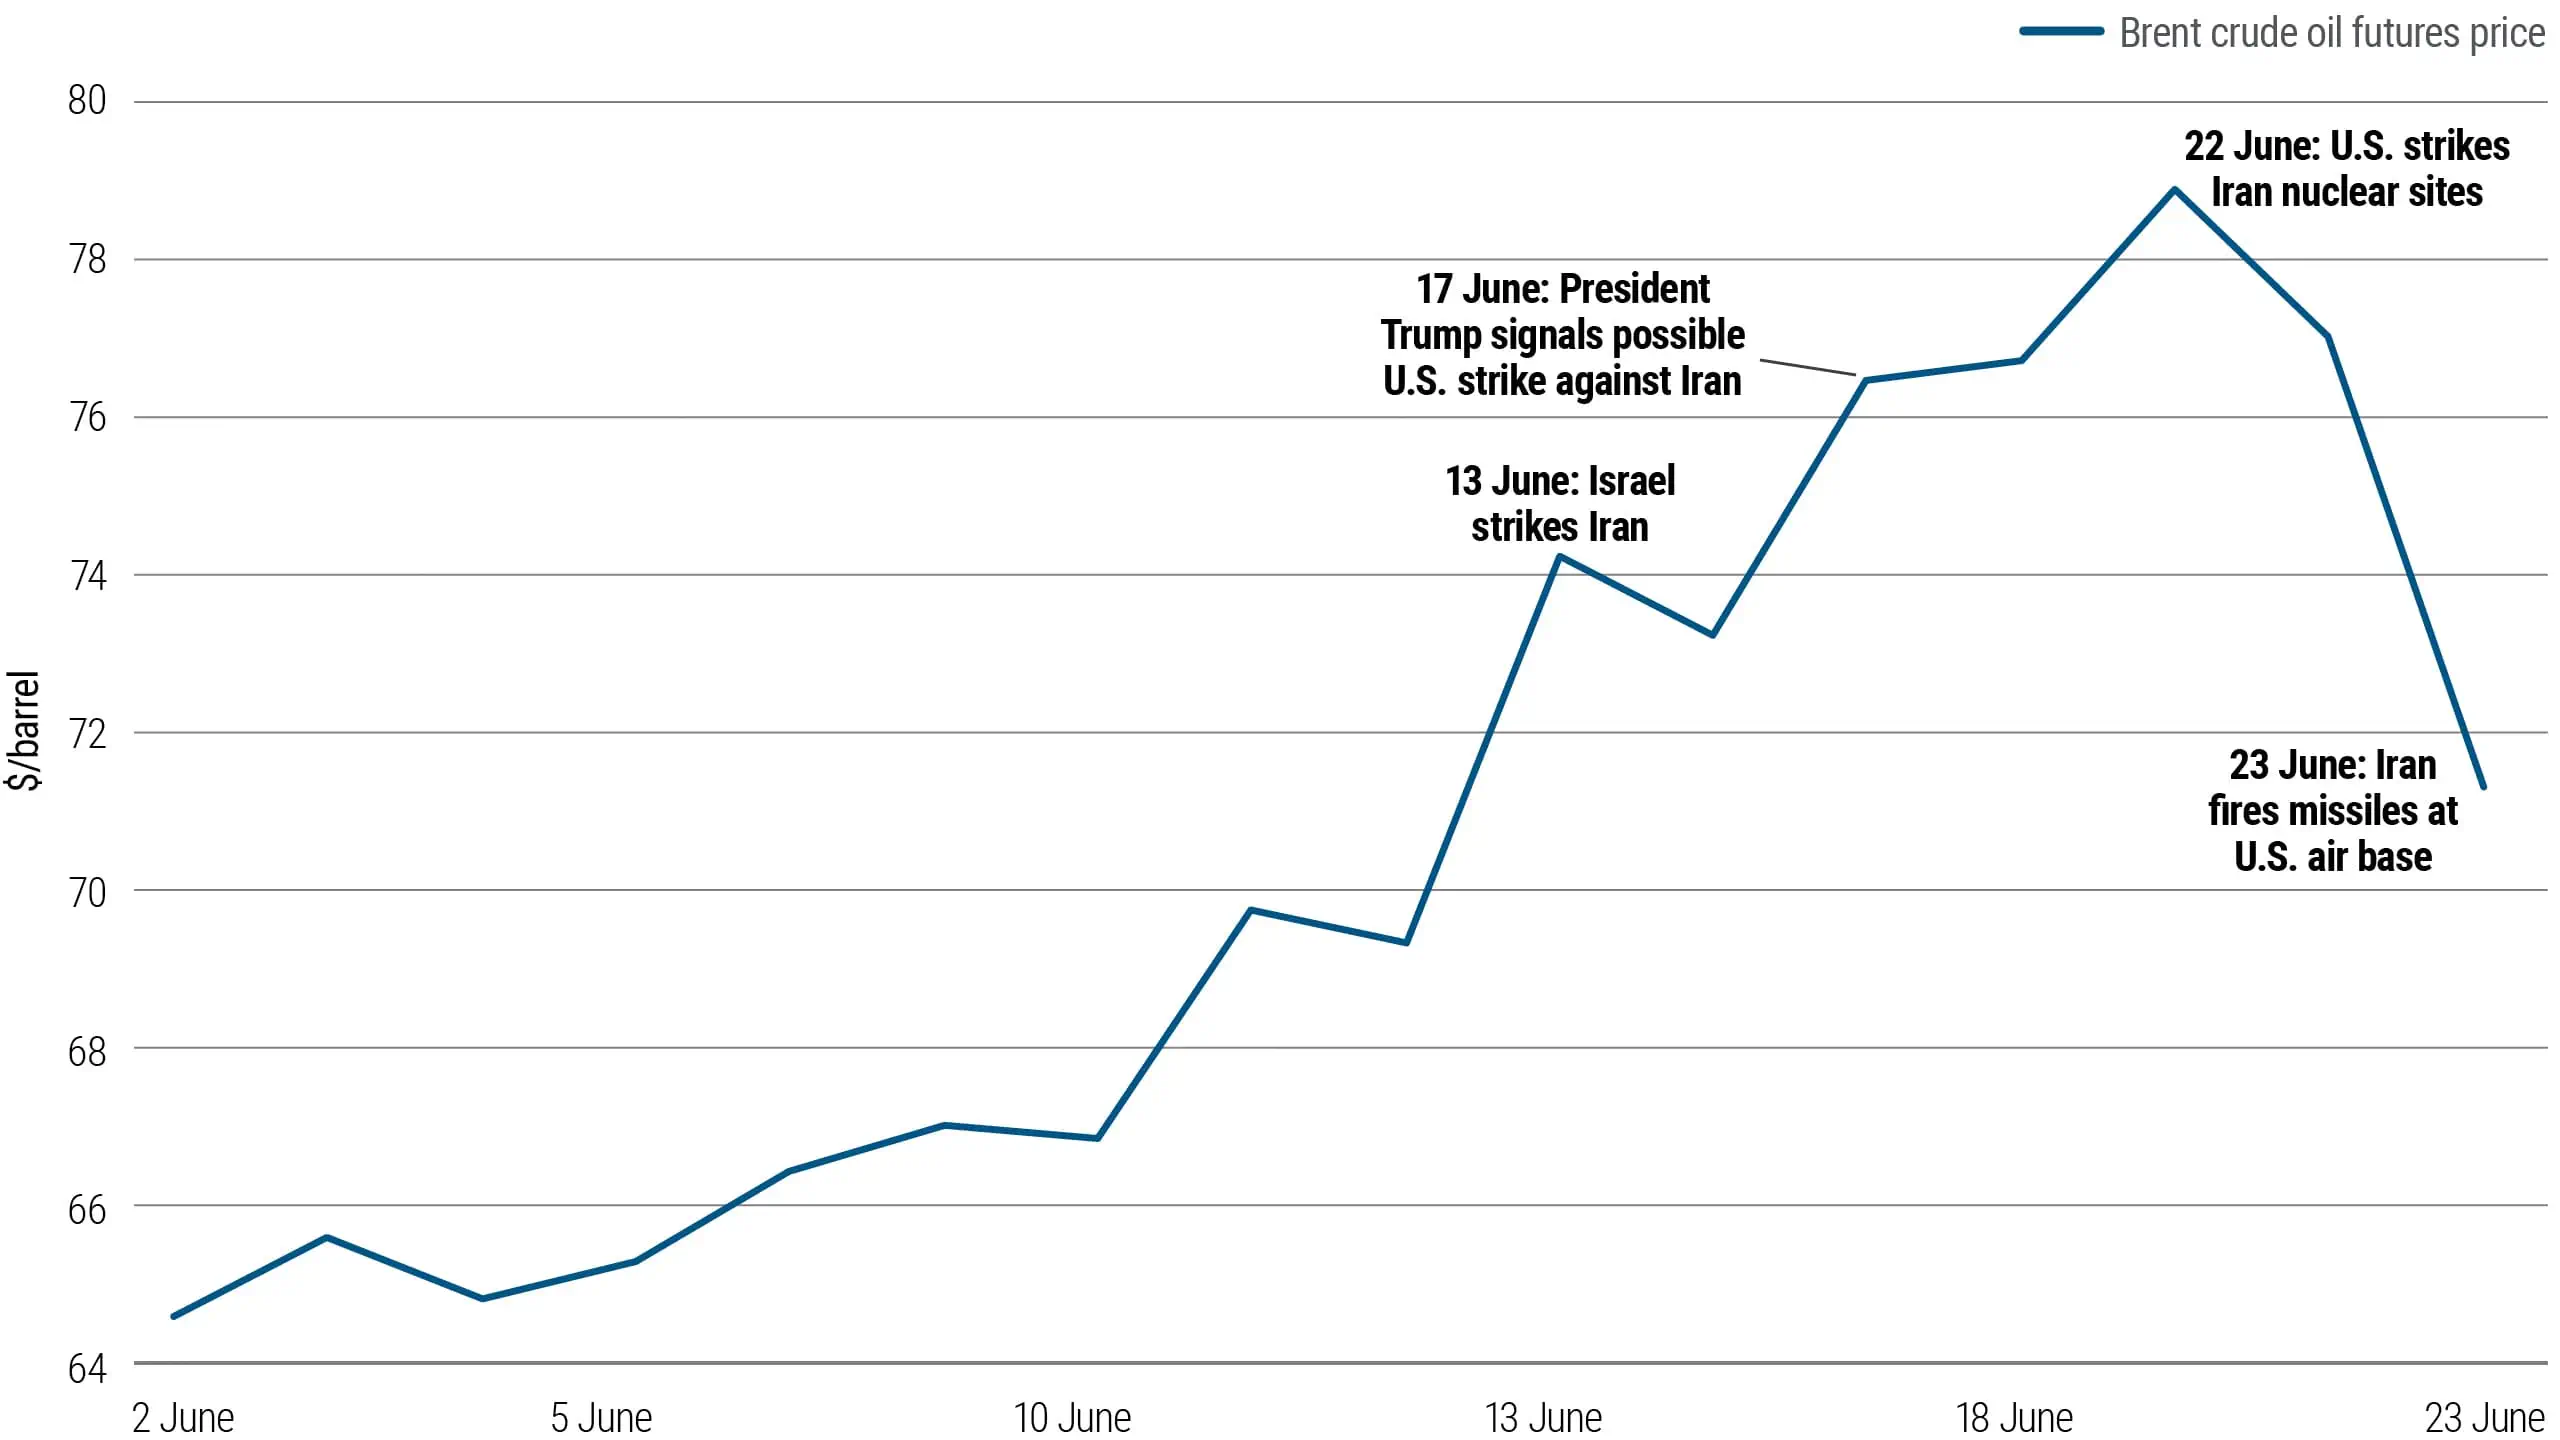
Chart 1: Market chart showing oil price spike before U.S. and Israeli strikes on Iran, followed by decline as geopolitical risk eased.
Source: PIMCO and Bloomberg as of 23 June 2025. Past performance is not a guarantee or a reliable indicator of future results.

OPEC spare capacity – A stabilizing force

If tensions in the Middle East re-escalate and Iranian oil supply is disrupted, we could see another spike in oil prices.

But there are key stabilizers in place: U.S. shale producers can ramp up output given enough time, and OPEC currently holds significant spare production capacity. While that spare capacity remains largely tied up in regions recently impacted by conflict – limiting its near-term ability to reassure markets – it could serve as a longer-term stabilizer for supply dynamics. 

These structural buffers may limit both the duration and the magnitude of any price rally.

So while short-term volatility is likely, we continue to expect oil prices to revert to the $60s range after any temporary spikes.

OPEC spare capacity
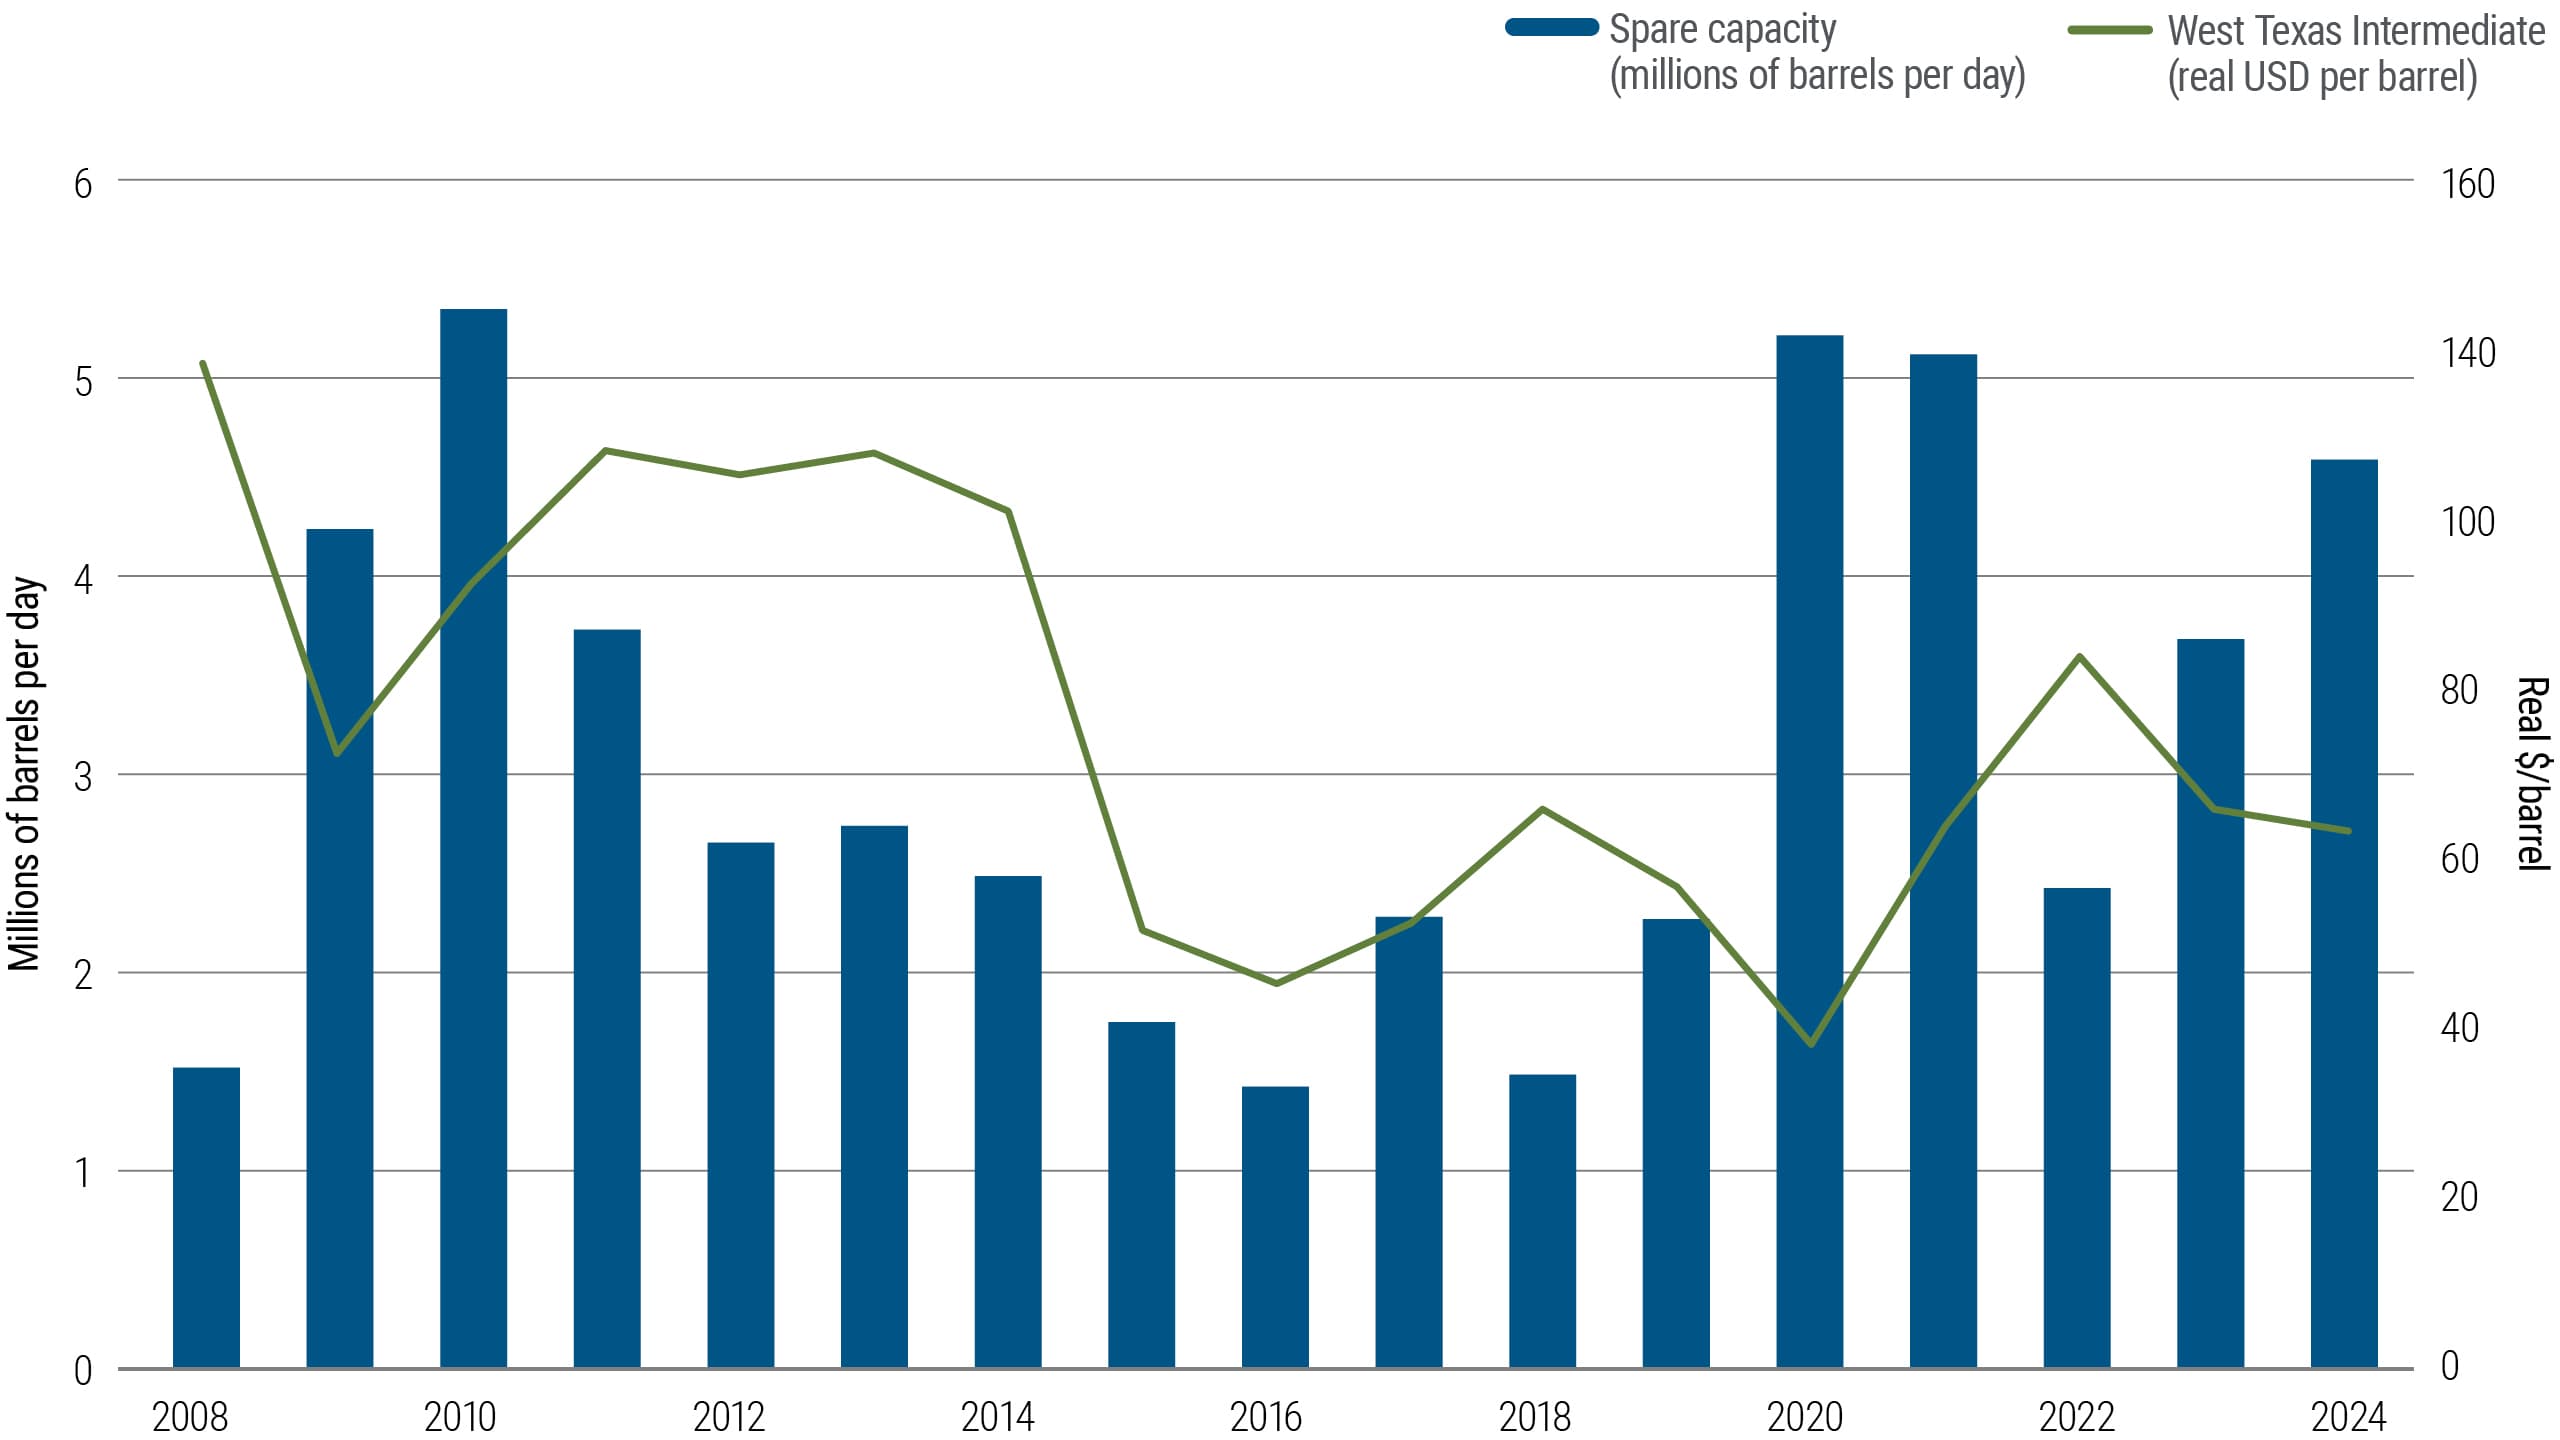
Chart 2: Market chart of OPEC spare capacity and WTI price showing supply buffers amid Middle East tensions and oil price volatility.
Source: PIMCO, EIA, and IEA as of 27 June 2025. Past performance is not a guarantee or a reliable indicator of future results.

Broader commodities show resilience as investors seek inflation hedges

While oil has experienced notable volatility, the broader commodity complex has remained remarkably steady this year. 

Gold prices continue to climb, supported by sustained central bank buying and ongoing de-dollarization efforts.

Base metals have also held firm, showing resilience even in the face of tariff-related growth concerns. 

Investors, recognizing their portfolios were underexposed to real assets and more vulnerable to inflation than expected, have renewed interest in gold and broader commodities.

Overall, the Bloomberg Commodity Index has delivered strong returns – demonstrating that a diversified commodity basket has the potential to help weather sector-specific shocks and contribute to portfolio stability.

Growth of $100 for commodities
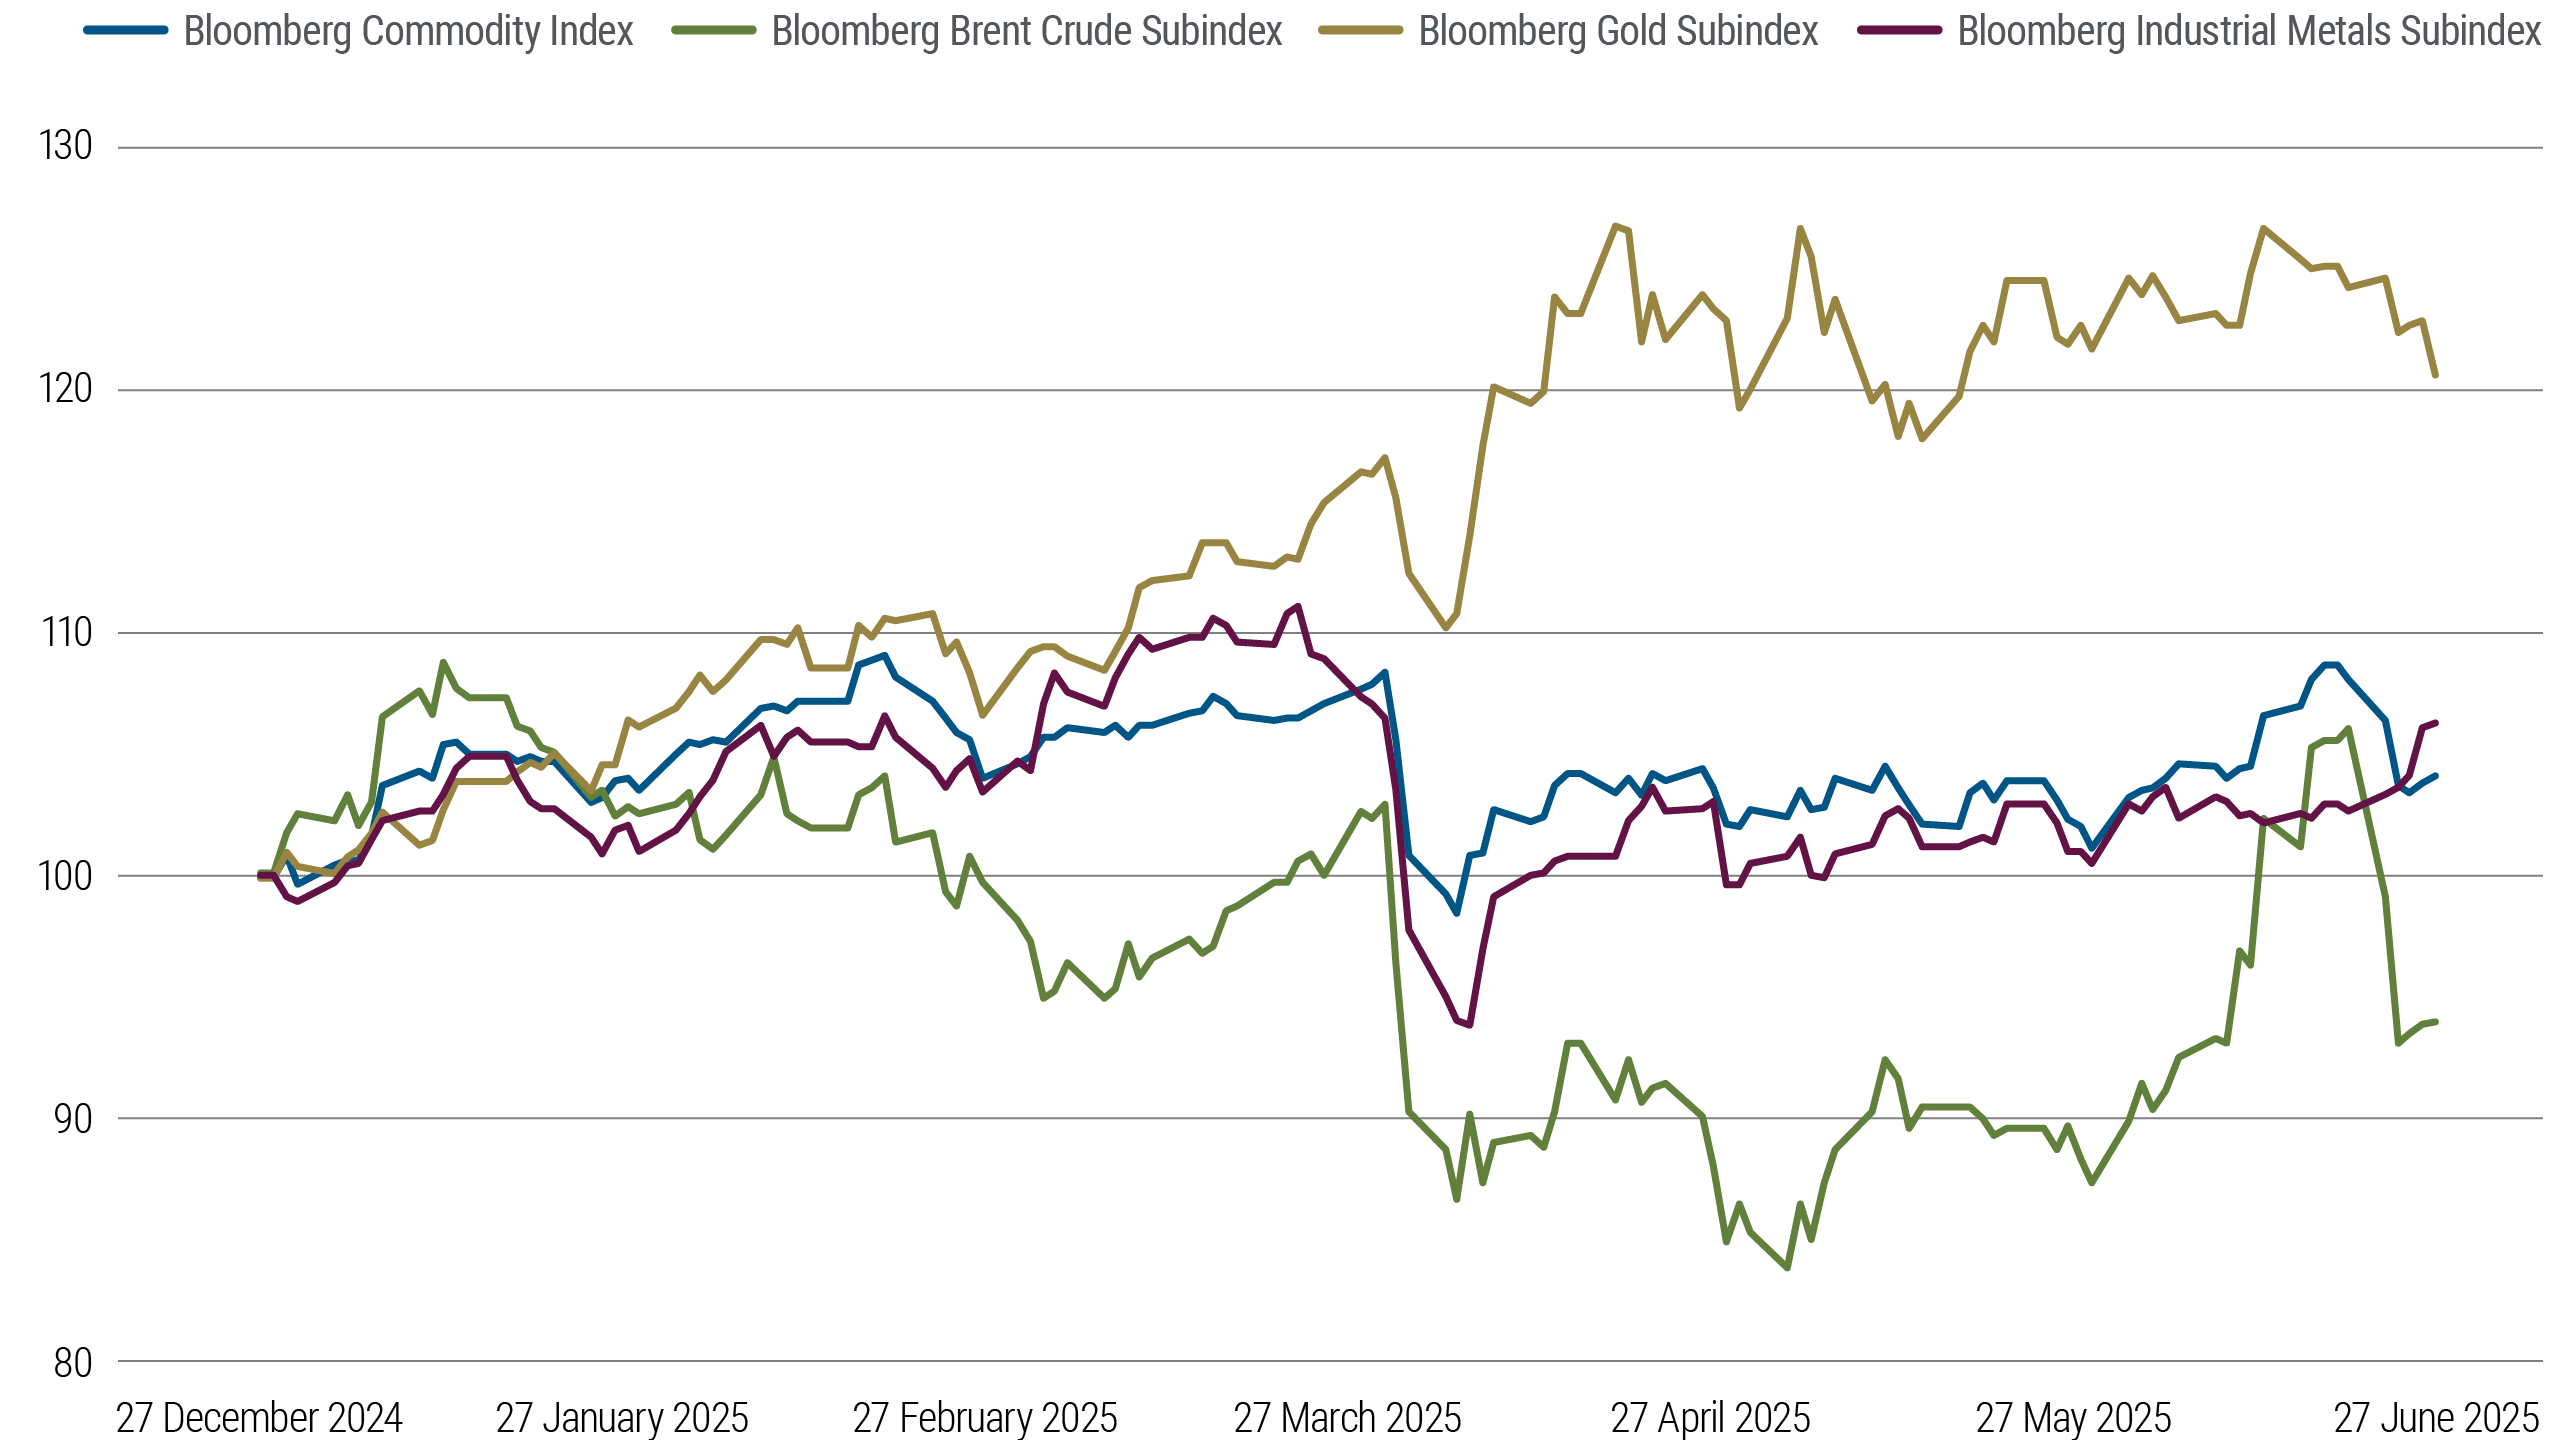
Chart 3: Market chart showing FICO inflation impact by credit tiers, with lower-tier scores rising more than higher-tier from 2015-2020.
Source: Bloomberg and PIMCO as of 27 June 2025. Growth of $100 based on daily returns of the Bloomberg Commodity Index, the Bloomberg Brent Crude Subindex, the Bloomberg Gold Subindex, and the Bloomberg Industrial Metals Subindex. Past performance is not a guarantee or a reliable indicator of future results.

Commodities as strong portfolio diversifiers

This diversification potential was also seen during the inflation spike in 2021–2022, when both stock and bond markets were challenged.

Commodities, however, maintained low correlations to both asset classes.

They have not only helped diversify portfolio risk but also enhanced inflation sensitivity – which we believe could make them a valuable option for strategic allocation in today’s environment of persistent inflation uncertainty.

Rolling 3-year correlations
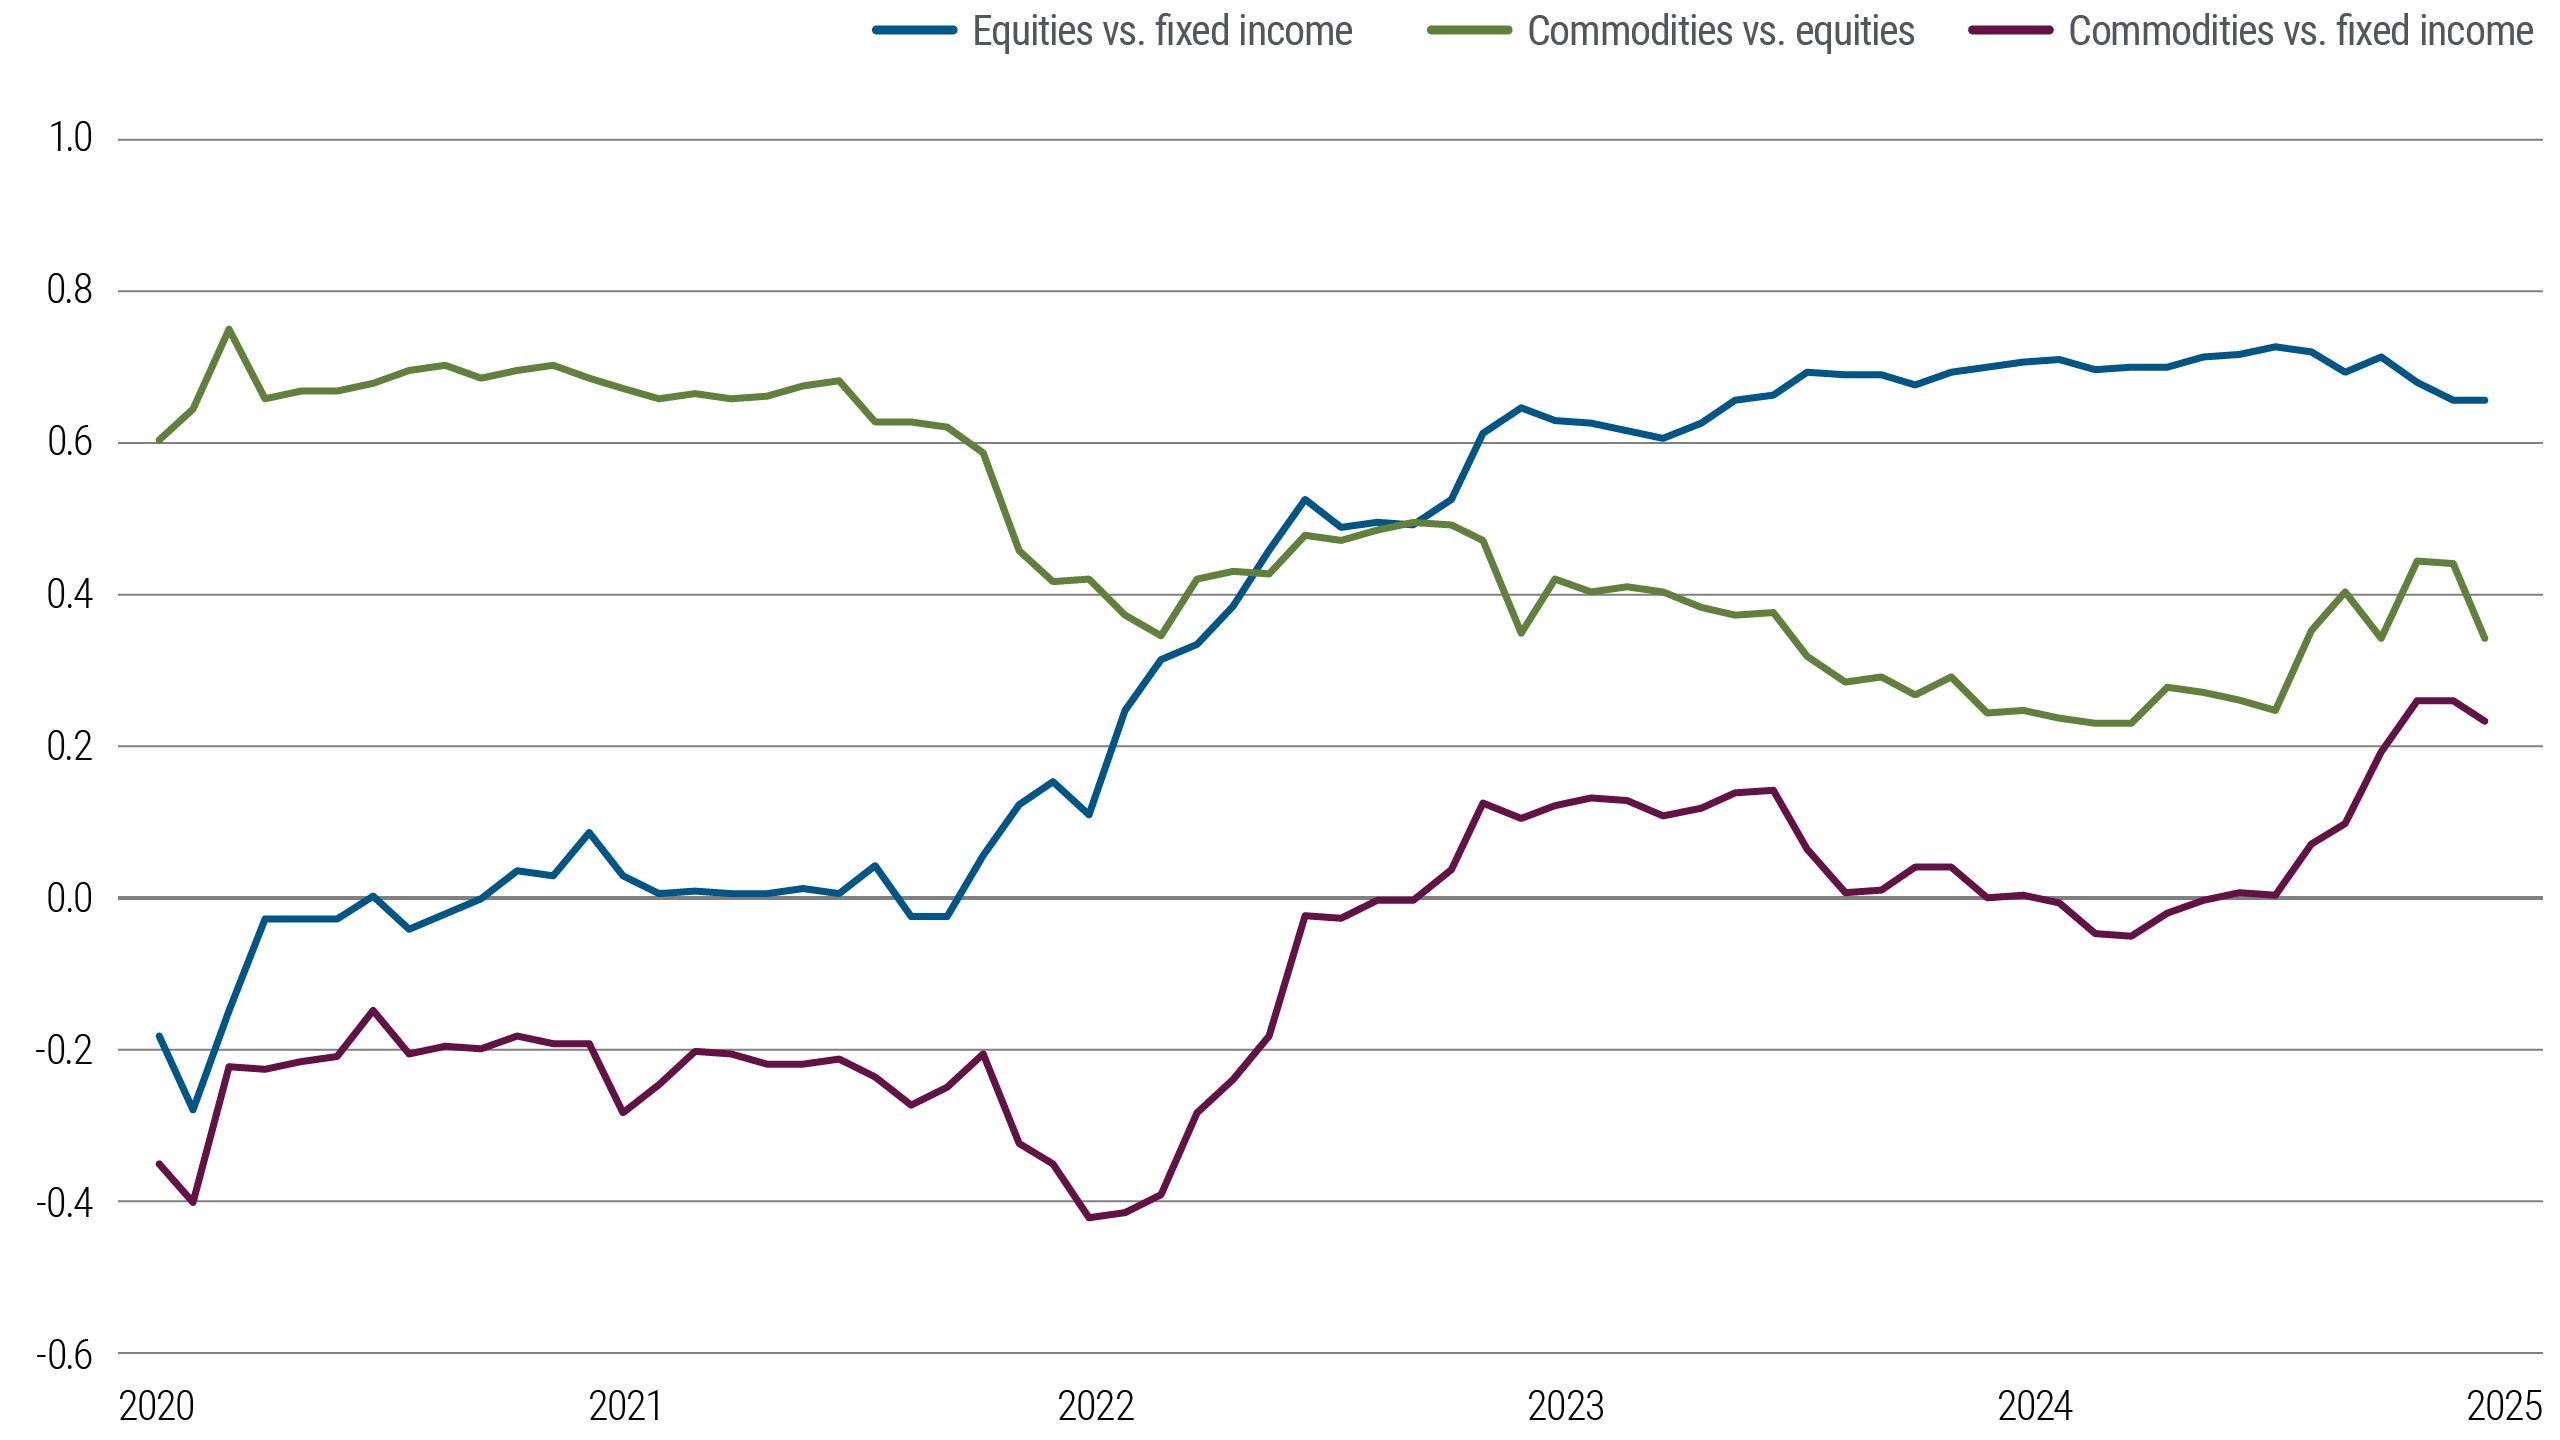
Chart 4: Market chart tracking Bloomberg Commodity Index with gold rising and base metals stable despite oil market volatility.
Source: Bloomberg as of 27 June 2025. Based on monthly returns of Bloomberg Commodity Total Return Index, S&P 500 Index Total Return (Equities), Bloomberg U.S. Aggregate Index Total Return (Fixed Income). Past performance is not a guarantee or a reliable indicator of future results.

Other Editions

PM Chartbook

Explore insights on the neutral rate and rising term premium, highlighting the impact on U.S. Treasury Yields, risk compensation, and strategic duration positioning with market and economic charts.

PM Chartbook

Peder Beck-Friis, an economist at PIMCO, charts rising government debt and its implications for the U.S. dollar and longer-term Treasury yields.

PM Chartbook

Kristofer Kraus, portfolio manager and co-lead of PIMCO’s asset-based finance business, charts the nuances behind the overall resilience of U.S. consumers – and explains how these insights shape lending and investment strategies.

PM Chartbook

Explore public credit markets charts from PIMCO expert Mohit Mittal that shows how public corporate credit has remained highly liquid and shown narrow bid-ask spread during recent market volatility.

PM Chartbook

Former Federal Reserve Vice Chair Richard Clarida shares three charts highlighting possible macro inflection points in the business cycle: from growth and inflation to debt and labor.

Featured Participants

Tell us a little about you to help us personalize the site to your needs.

Terms and Conditions and Privacy Policies

Please read and acknowledge the following:

{{!-- Populated by JSON --}}

Select Your Location


Americas

Asia Pacific

  • Japan

Europe, Middle East & Africa

  • Europe
Back to top