


Summary
- Contrary to common wisdom, long-dated STRIPS, especially in large allocations, may not be a good match to corporate pension liabilities.
- Instead, a holistically designed portfolio (with a customized blend of credit and government bonds) tailored to key liability risks may deliver a more resilient hedge and lower tracking error.
- In addition, plan sponsors can harness capital-efficient solutions using liability-friendly equity strategies, potentially achieving improved funding ratio outcomes.
The primary objective of liability-driven investing (LDI) is a simple one – managing risk. Yet defining LDI is complex because this common investment strategy comes in a variety of flavors. All of them, however, typically seek a better alignment between a pension plan’s liability risk factors (such as duration) and its liabilities. In practice, LDI investors will often be looking to extend the duration of their portfolios to match the long-dated nature of liabilities.
Fortunately, plan sponsors have many tools to amplify the interest rate sensitivity of their portfolios – from repositioning their existing fixed income allocation toward longer-duration bonds to increasing their fixed income allocation to implementing derivatives overlays. The options are sufficient to accommodate the wide range of preferences and circumstances plan sponsors face.
One option, using long Treasury STRIPS, may seem interesting on the surface. These instruments tend to have very long durations (about 27 years); they can help plan sponsors achieve their duration-extension targets with limited capital commitment to fixed income, or achieve a relatively high duration hedge ratio for a given commitment. However, upon deeper analysis, the drawbacks of long-dated STRIPS appear to outweigh their advantages – and we find this to be especially true in today’s historically low interest rate environment. As such, we favor other options to seek to achieve duration hedging targets in a capital-efficient manner.
Strips as a Liability Hedge?
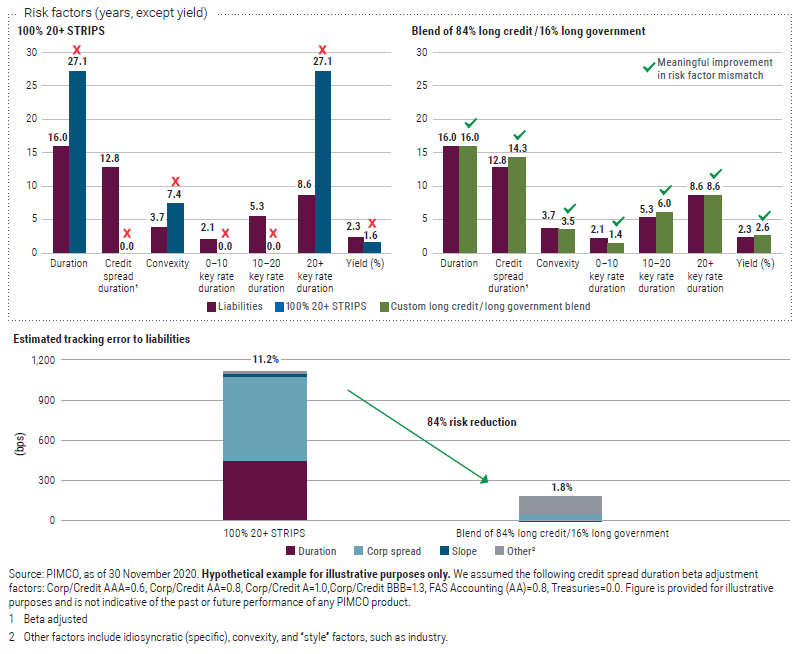
Given how prevalent STRIPS are in some LDI programs, it may be a surprise that they are not a very good fit to pension liability risk factors compared with other approaches. As Figure 1 shows, STRIPS-based strategies create significant mismatches relative to pension liabilities – across maturity profile and curve risk as well as credit spread hedge. In contrast, a diversified blend of long credit and long government bonds potentially creates a more holistic match to key liability risk factors; they tend to have a very low tracking error risk profile to the liabilities relative to STRIPS-based strategies (1.6% versus 11%).
Furthermore, pension liabilities typically grow consistent with their discount rate (a blend of high quality corporate bond yields). As of 30 November 2020, long Treasury STRIPS were yielding 1.6% and average liability yields were 2.5%–2.75% (according to FTSE for 20+ STRIPS and the FTSE discount curve for the liability yield). Thus, portfolios with large allocations to STRIPS are unlikely to keep up with ongoing liability accruals, whereas portfolios with heavier allocations to long-dated credit (which were yielding about 3%, according to Bloomberg Barclays) will likely perform better.
Figure 1 – STRIPS as a liability hedge – worth reconsidering?
It is important to note that appropriate hedging strategies should perform not just under very specific or narrow scenarios (for example, when the back end of the yield curve flattens with no credit spread tightening), but also across a variety of market environments. After all, the point of hedging the liabilities is to recognize and prepare for the uncertainty in markets. This calls for more resilience in the design of the liability-hedging strategy, as it will need to work in almost any type of market environment. In preparing for any market environment, large STRIPS allocations are more of a subjective call on the shape of the yield curve than a robust liability hedge.
Fortunately, the tactical position that some plan sponsors had with STRIPS allocations in their LDI programs paid off over the last few years as rates dropped dramatically and the yield curve flattened. More important, we feel there is an opportunity for plan sponsors who have benefited from STRIPS to prepare for future uncertainty by considering the following:
- Lock in gains before they evaporate – this can help plan sponsors come out on the right side of that original tactical call.
- Reposition the structure of their LDI program to make it more resilient and a true hedge that works in a wider array of market environments than STRIPS.
This may be the right time to build a more resilient liability hedge
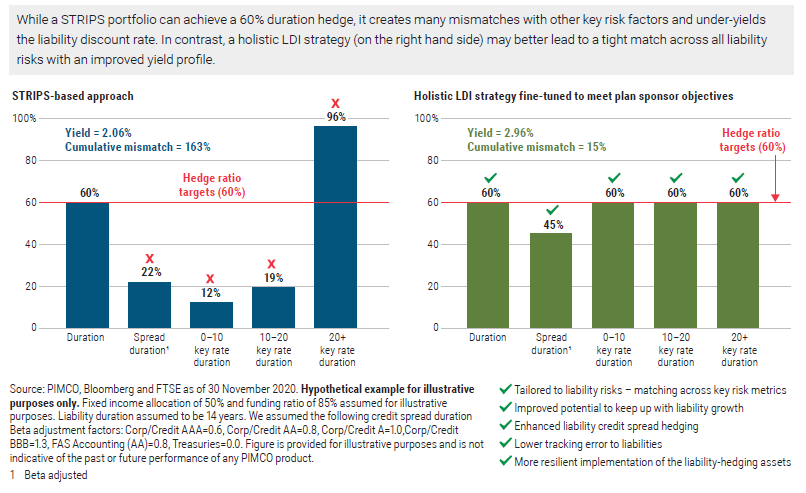
Plan sponsors with meaningful STRIPS allocations can take advantage of the current market environment to lock in any profits and seek to make their LDI program more resilient and better adapted to the years ahead. One option could be accomplished by redeploying STRIPS allocations into a long duration portfolio that better balances credit and government bonds, and is potentially paired with Treasury futures that in aggregate target the desired liability hedge (or align the duration with that of STRIPS), as shown in Figure 2. This approach has the following potential benefits:
- May allow for a more robust hedge that aligns the portfolio with each liability risk factor (duration, credit, curve, etc.) as opposed to overemphasizing one factor at the expense of others.
- Pivots to higher-yielding long corporate credit that is better aligned with the plan sponsor’s liability yield, an important consideration in the current low yield environment. While long-dated STRIPS now provide a yield modestly above 1.5% and have limited opportunity for active management, long-dated credit yields are still hovering around 2.8%, according to data from Bloomberg Barclays. That creates ample potential for active management to seek to further enhance that yield advantage.
- Ability to maintain capital efficiency in line (or better than) STRIPS through the use of duration overlays paired with a more robust LDI portfolio.
- Bundling the robust LDI portfolio with the Treasury overlay can also streamline implementation of the hedge and reduce potential disruption in the composition of the LDI program. Treasury STRIPS mandates tend to be a standalone sleeve (“unbundled” ) in LDI programs. This can create frequent rebalancing needs in the LDI program and the potential to drift away from strategic hedge targets. (See our 2018 Featured Solution, "Treasury STRIPS in Capital-Efficient LDI Strategies: Missing the Mark.")
Figure 2 – A better way to target your liability hedge
Sweetening The Deal
In addition to increasing the resilience of their liability-hedging allocations with holistically tailored LDI strategies, plan sponsors can potentially achieve even better outcomes by further enhancing their portfolios with an allocation to liability-friendly equity strategies. In this strategy, we obtain equity exposure synthetically via derivatives (typically equity futures and total return swaps) and pair this exposure with an actively managed, high quality long bond portfolio that seeks a return roughly in line with the growth of an interest-rate-sensitive liability. It is designed to seek to provide equity returns over the growth of liabilities in a single portfolio. This allows plan sponsors to:
- Target a more liability-aware return-seeking allocation, which we believe to be instrumental for future funding ratio improvements (as you are earning equity returns on top of long bonds, which is a proxy for liability growth).
- Improve the plan’s hedge to liability credit spread duration
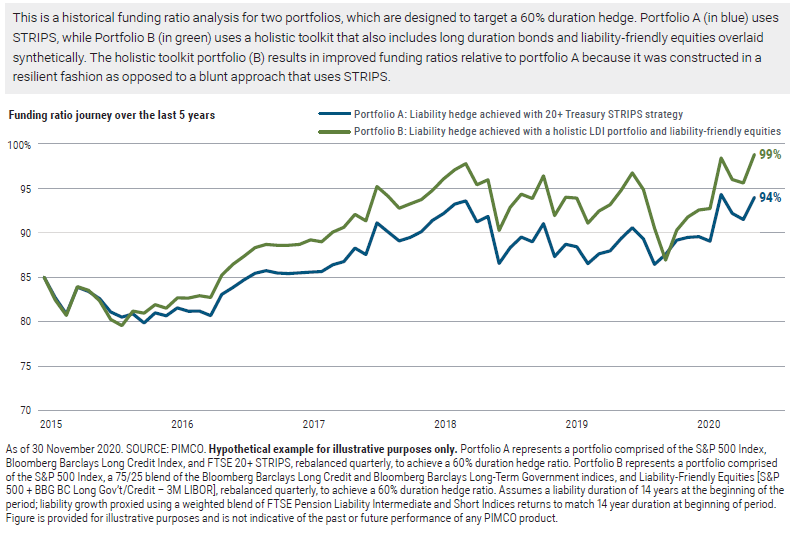
– important given liability corporate bond discount rate methodologies in the U.S. - Maintain the same capital efficiency and duration hedge ratio the plan would have had with a STRIPS allocation, but with the possibility of higher expected return potential. We compared how two portfolios performed over the last five years (one used just STRIPS, while the other used a liability-friendly equity strategy). Relying on multiple sources of return, the portfolio with liability-friendly equities had significantly better funding ratio outcomes over the last five years (about five percentage points higher), as shown in Figure 3.
Figure 3 – Liability-friendly equities – improving funding ratio outcomes for the same hedge as STRIPS
Conclusion
The unknowns of the post-COVID market landscape require greater attention to the composition of LDI programs. While plan sponsors who used Treasury STRIPS in their LDI allocation have certainly benefited over the last few years, the low level of Treasury yields and the realization that return prospects could be lower going forward provide an opportunity to take profits and redeploy them into strategies with the possibility of better liability-hedging potential and a diversified stream of returns. As illustrated earlier, these alternatives to STRIPS can target the same level of liability hedge but with improved resilience and potential for outperformance with diversified sources of return. As such, the prospects for building a high quality liability hedge are stronger than ever in our view.