Summary
- With the launch of gold Exchange Traded Funds (ETFs) in the United States in 2004, gold has now become a liquid financial asset.
- Several factors influence gold prices, including inflation, interest rates, market sentiment, as well as supply and demand.
- PIMCO believes changes in real (inflation-adjusted) yields have been the most significant drivers of gold prices over the past couple of decades.
- For investors, understanding the relationship between gold prices and real yields can help them assess the role of gold in their portfolios.
- Amid macroeconomic and geopolitical uncertainties, investors may be well served by staying diversified and allocating to assets, such as gold, that have the potential to mitigate idiosyncratic risks.
To understand how real yields impact gold prices, it helps to start with a simple example. Pretend there was an asset that had no risk of default and a real – that is, inflation-adjusted – value that varied over time but did so around some constant level. In other words, this asset has no credit risk and in the long run maintains its purchasing power. How much would investors pay for it? Whatever the amount, it would likely vary over time with the level of real yields available in high quality, nearly “default-free” assets (such as U.S. Treasuries). That is, when real yields on other such assets are high, investors would likely want a bigger discount to the long-run estimated real value of the hypothetical asset. Conversely, when real yields are low, the opportunity cost of owning the asset drops and investors would likely be willing to pay a higher price relative to the asset's long-run estimated real value.
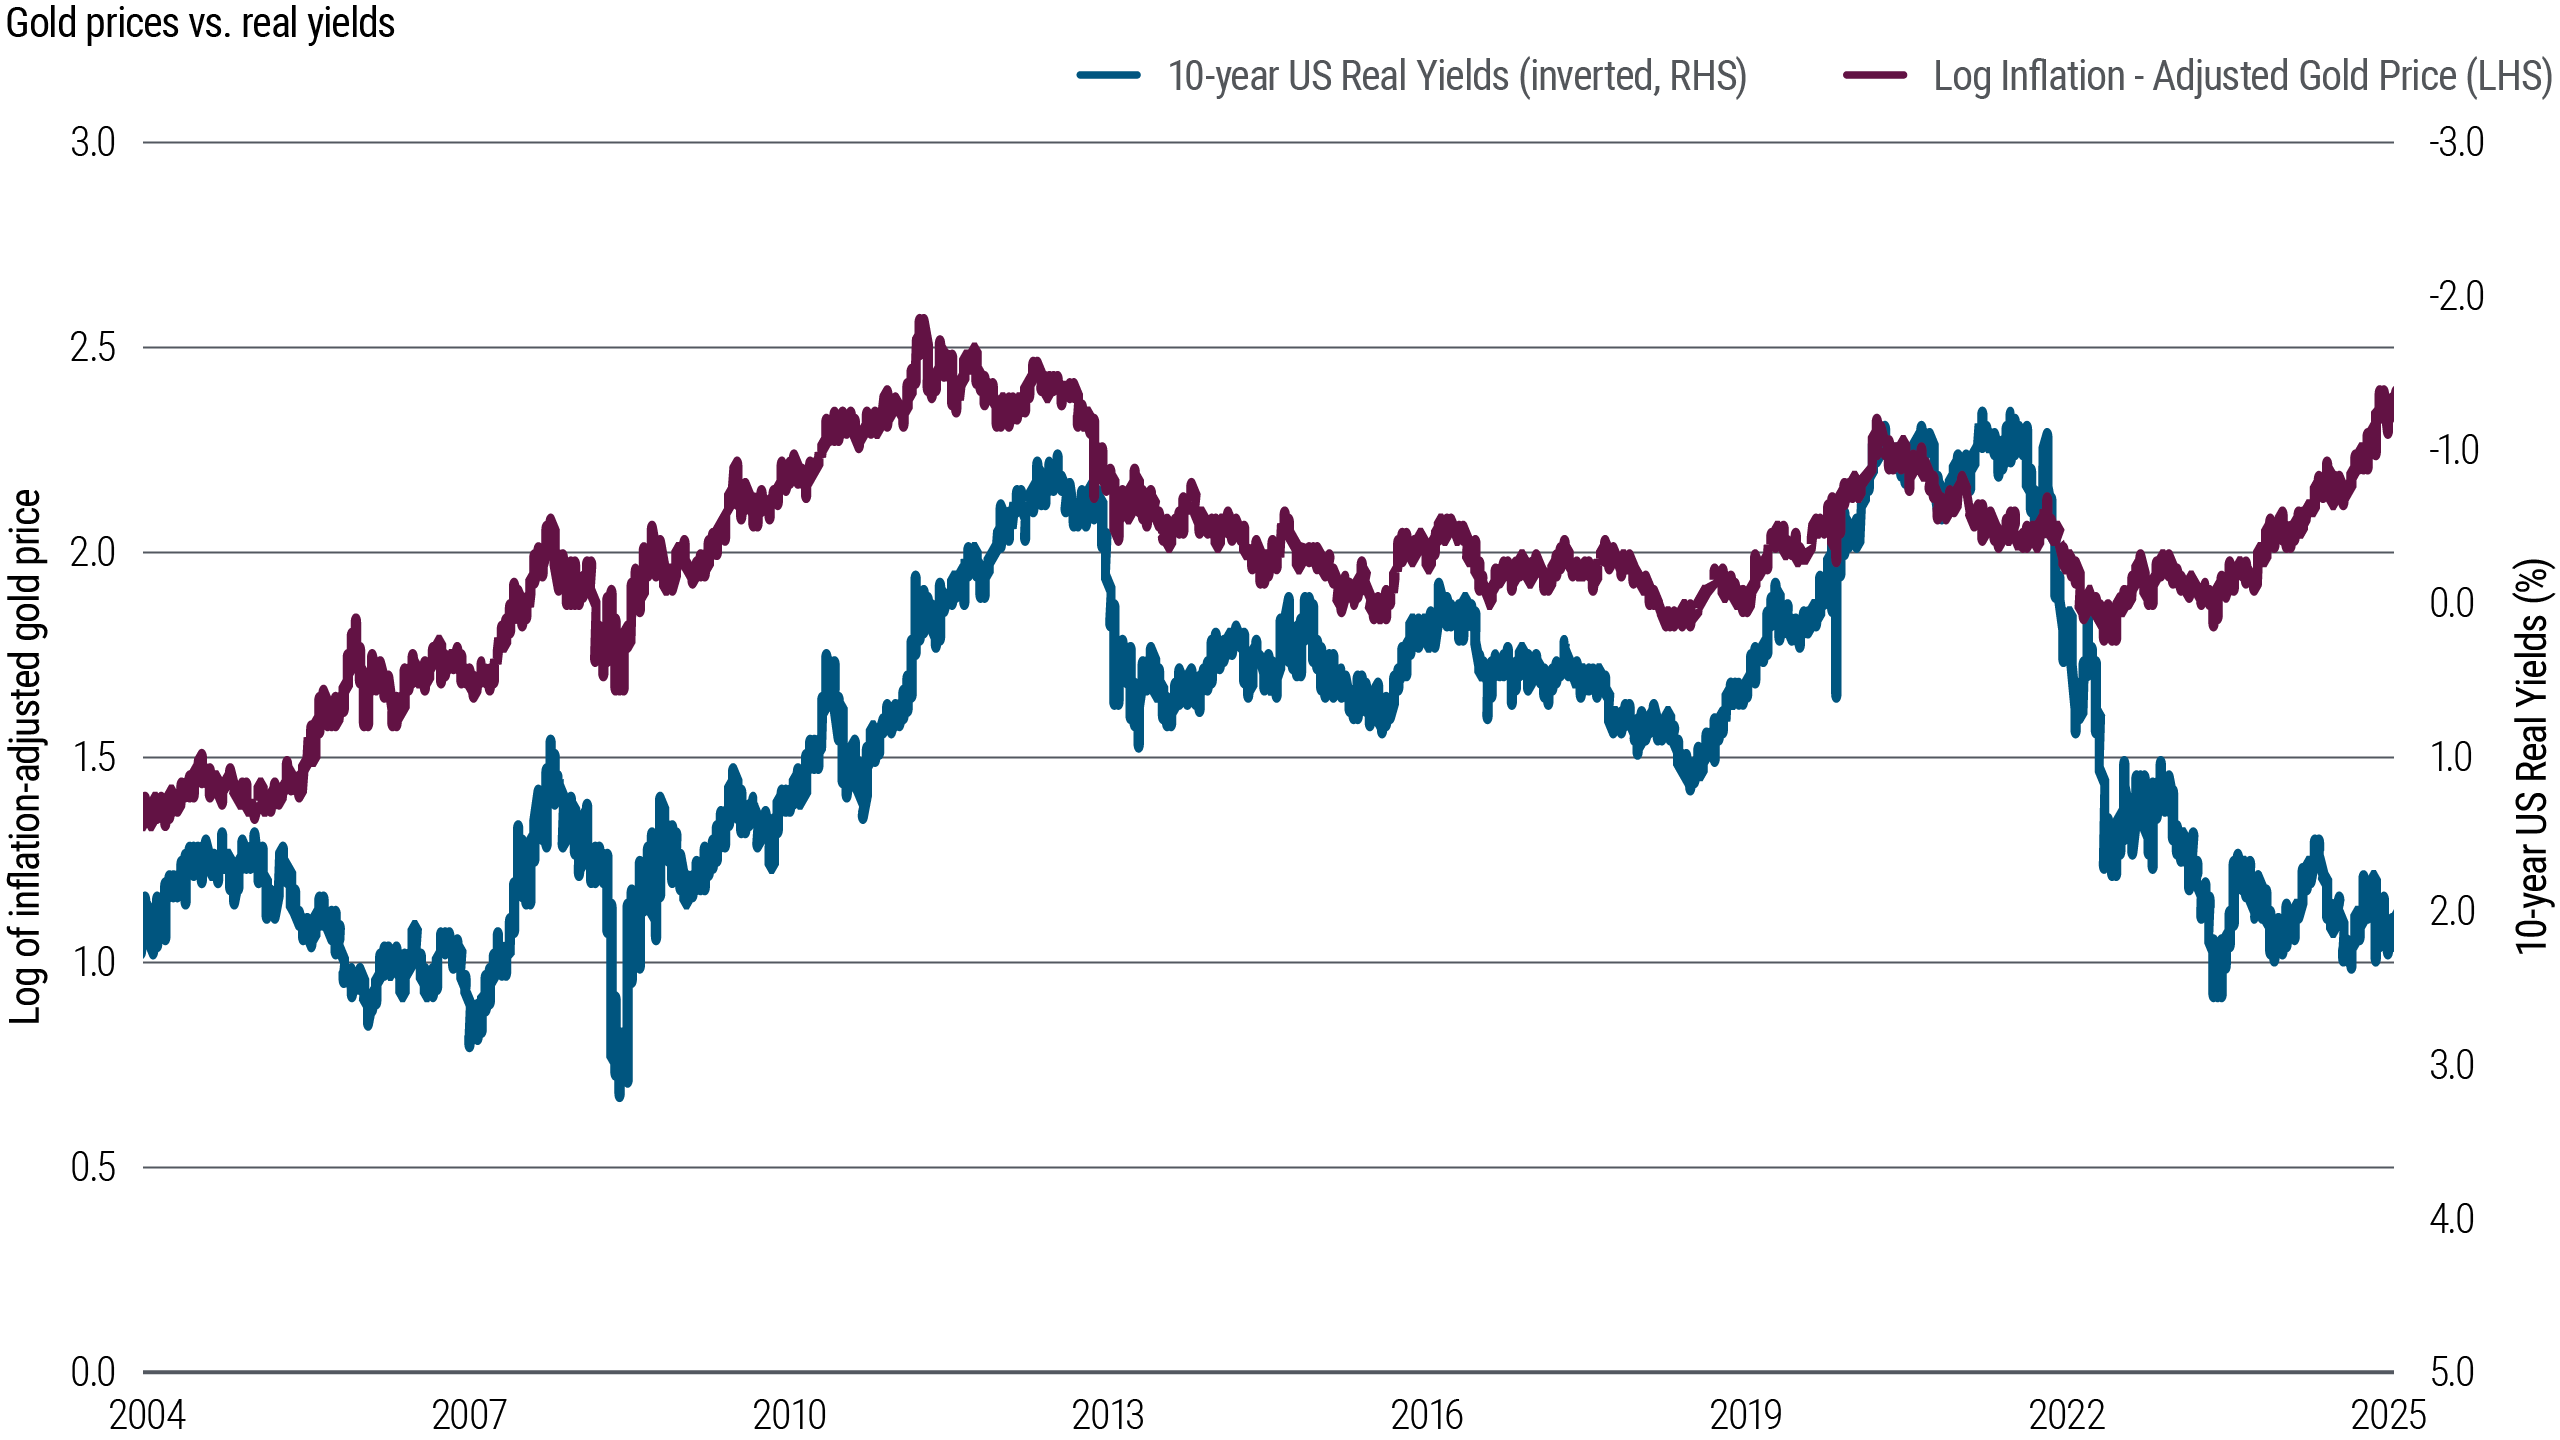
In essence, this guides how PIMCO thinks of gold. And the market seems to view gold this way as well; for over two decades, gold prices have been heavily influenced by the level of 10-year U.S. real yields (see Figure 1).
Figure 1: Gold Prices Are Heavily Influenced by 10-Year Real Yields.

As of 30 June 2025 Source: Bloomberg, PIMCO data
Figure 1 shows the logarithm of the inflation-adjusted price of gold and the 10-year U.S. real yield from the U.S. Treasury Inflation-Protected Securities (TIPS) market. Using the logarithm makes the size of a given percent change constant over time (gold prices increased from ~$700/oz, in today’s dollars, to more than $3,200/oz from 2004 – 2025, so a $100 move in 2004 is not the same percentage change as a $100 move in 2025). We also divided the gold price by the U.S. Consumer Price Index (CPI) to control for the general increase in real asset values over time. Since we expect gold prices to rise when real yields fall, we have inverted the axis of the 10-year real yield.
Recent history has changed the behavior of gold prices
With the launch of gold Exchange Traded Funds (ETFs) in the United States in 2004, gold has increasingly become a liquid financial asset. But over much of history, the price of gold was either fixed or gold was a relatively illiquid physical asset held by a small portion of investors. Today, the marginal price of gold is largely set by financial demand, as over $150 billion of gold is held by ETFs in the United States alone1, and investors choose to buy or sell gold ETFs by comparing the expected real return on gold to that of other liquid financial assets. This means that the future behavior of gold is more likely to resemble the past couple of decades rather than the 1970s or some other period.
To quantify the relationship between real gold prices and real yields, we can regress the price of gold from 2004 to 2025 (we used the logarithm of the real price of gold in our model) against the 10-year real yield from the U.S. TIPS market. (In our view, this regression is appropriate since gold and real yields are co-integrated and there is an economic rationale for believing they should be.) Based on our study, the regression shows that, all else equal, a 100-basis-point increase in 10-year real yields has historically led to a decline of 18% in the inflation-adjusted price of gold. In other words, over the past 20 years, gold has had a real duration of 18 years. Note that this is solely an empirical duration that describes the way that gold has traded. Since gold has no cash flows, its duration does not need to be constant, and there is nothing magical about the 18 number. Just as the correlation between stocks and bonds varies over time depending on changes in macroeconomic variables and investor risk appetite, the real duration of gold may also change in the future.
Using this framework, consider the 15% price drop in gold in April 2013 following talk of U.S. Federal Reserve (Fed) tapering. This move predated the sharp move higher in yields in the fixed income market by two weeks. Over the month of May, 10-year real yields rose 57 basis points. Even though the markets moved at different times, the size of their moves over this period was remarkably consistent with the historically observed 18-year real duration. In hindsight, we believe the move in gold gave an early warning of both the direction and magnitude of the move in rates.
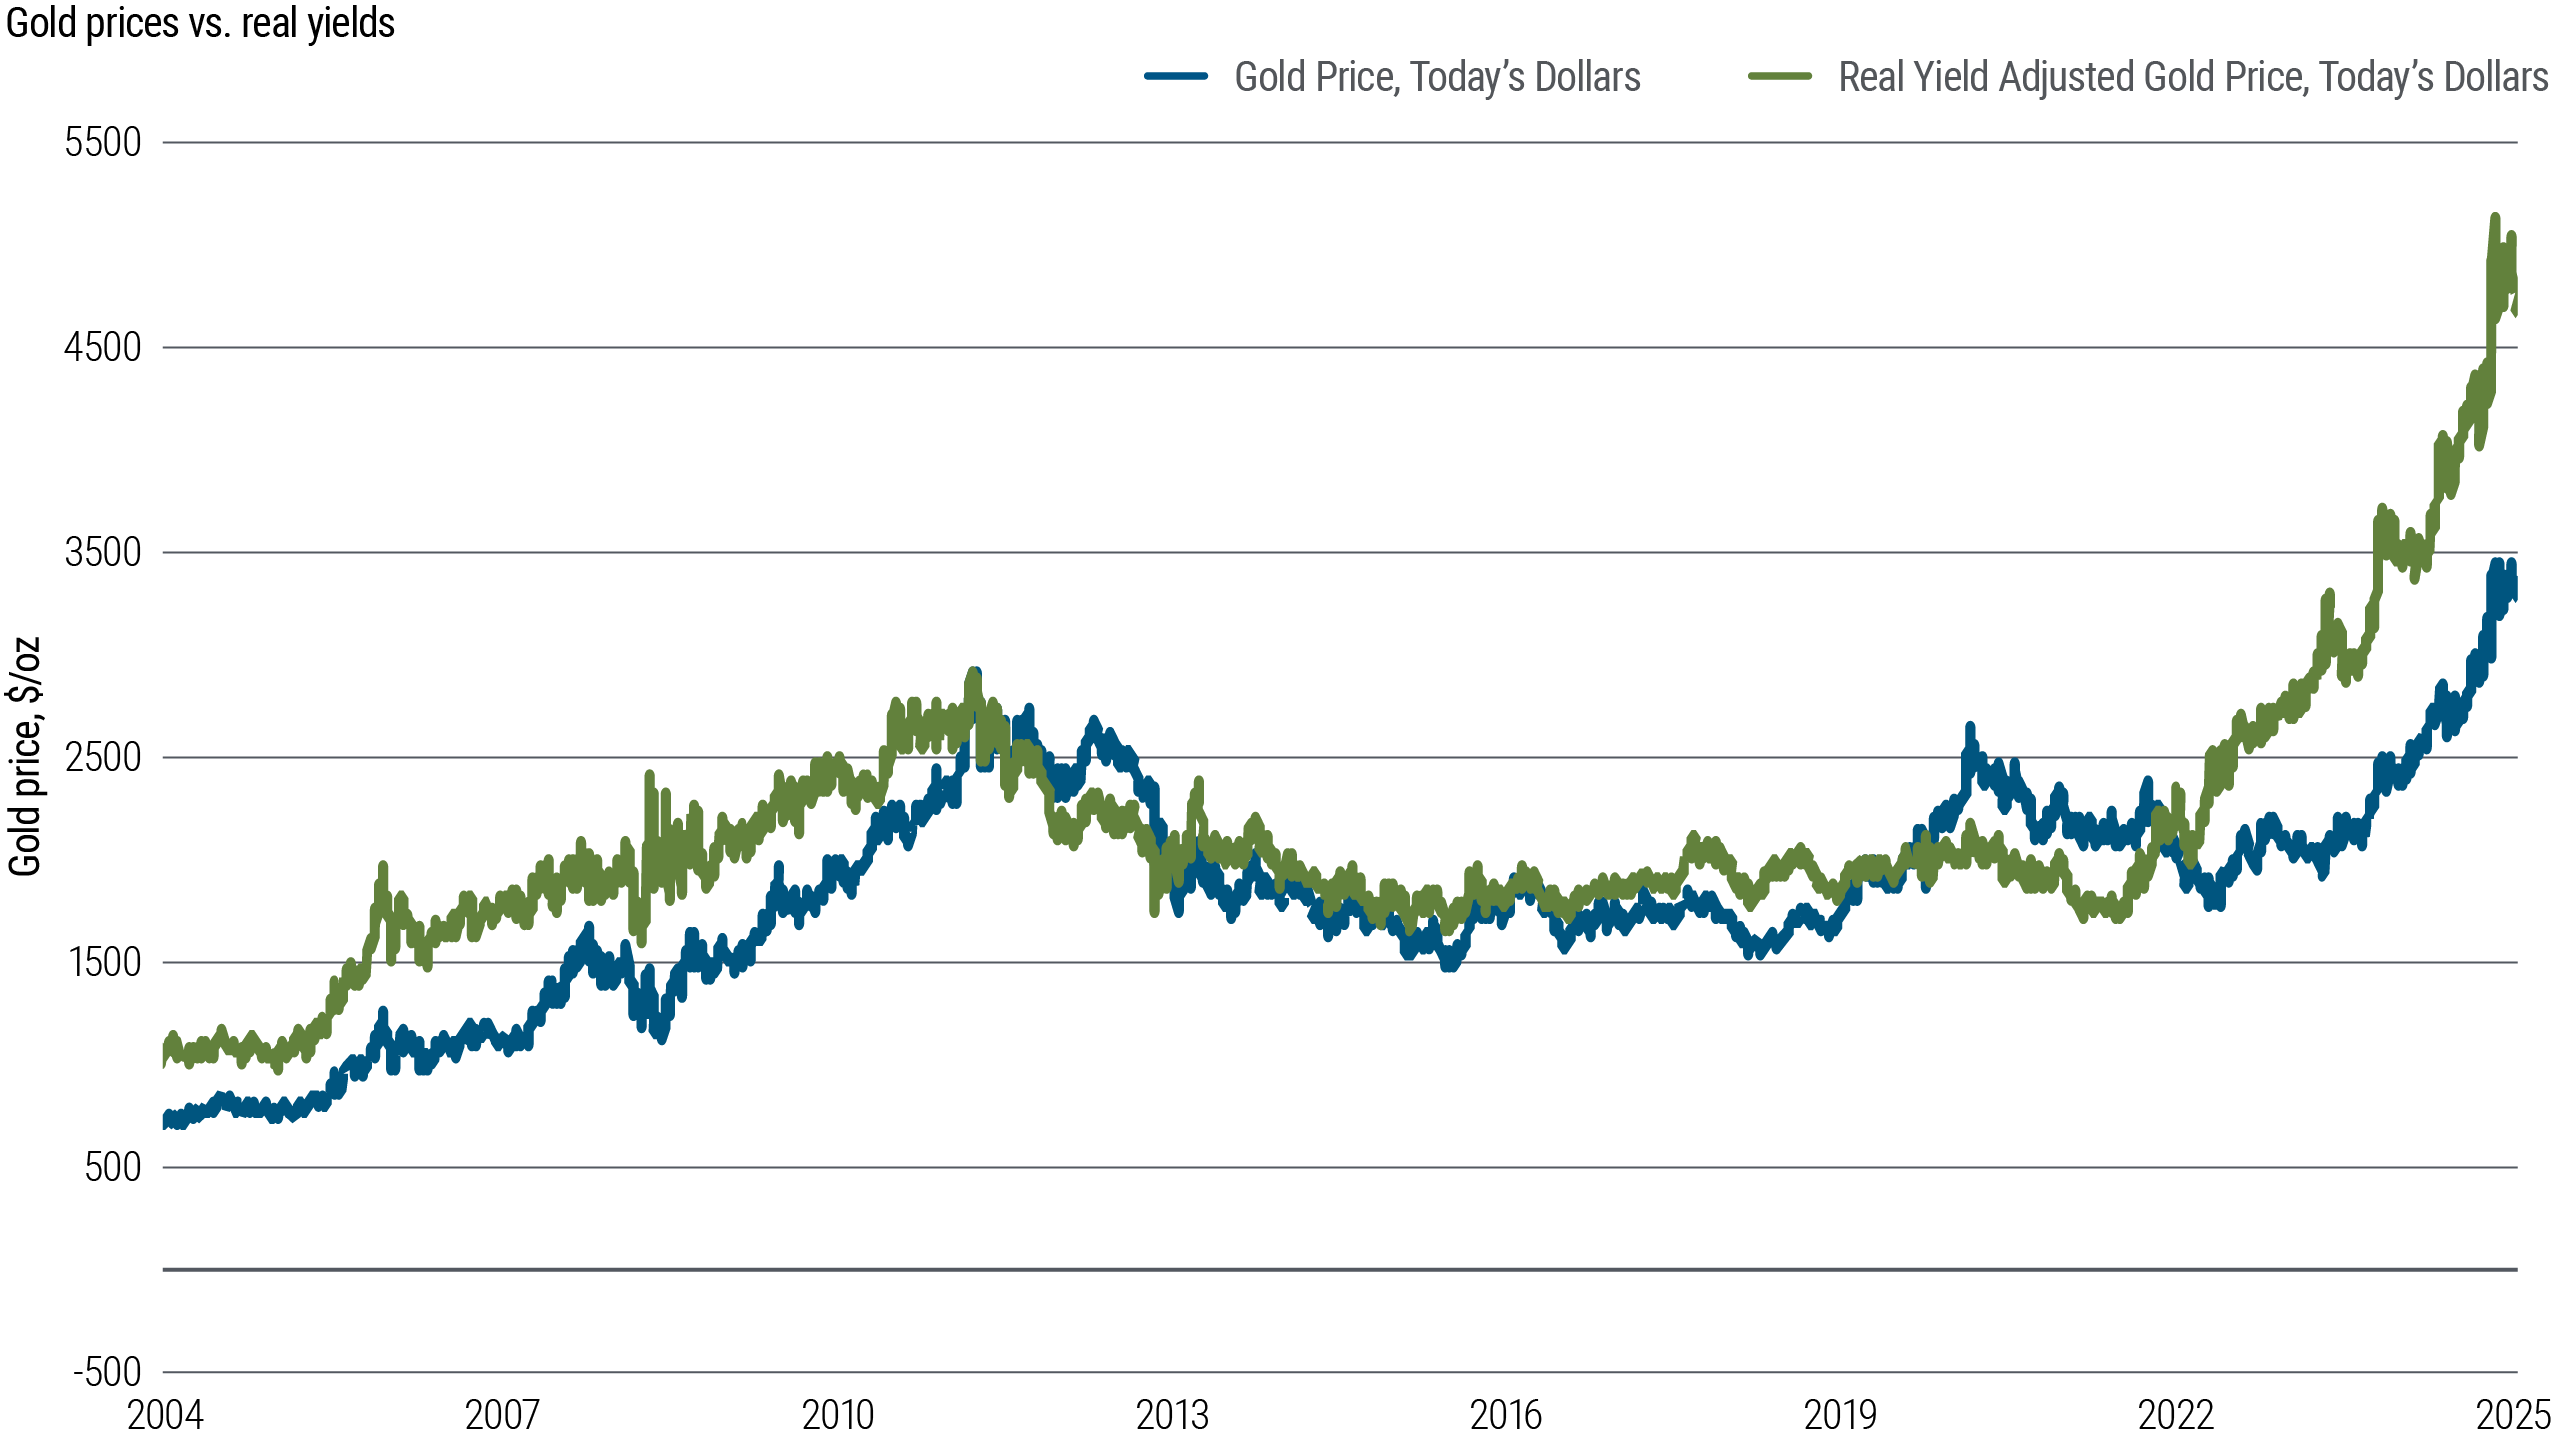
Another potential use for the empirical duration of gold is to see how gold prices have changed over time after controlling for moves in the level of real yields. By computing a real yield-adjusted gold price, we can look at a gold price that adjusts for the fact that the opportunity cost of owning gold varies over time. The real yield-adjusted gold price is calculated by adjusting the gold price by a discount factor based on an 18-year real duration and the level of real yields (see Figure 2).
Figure 2: Movements of Real Yield-Adjusted Gold Prices Versus Spot Prices.

As of 30 June 2025. Source: Bloomberg, PIMCO data
If real yields explained all the moves in gold prices, we would expect this real yield-adjusted gold price in constant dollar, i.e., adjusted for inflation, to be completely static and never move. In other words, all moves in the inflation-adjusted price of gold would be fully explained by a change in the discount factor that links today’s gold price with the real yield-adjusted gold price. While the real yield-adjusted gold price moved around in Figure 2, it generally did so over a smaller range than the inflation-adjusted price of gold. The last several years have been an exception given a shift in central banks’ gold buying patterns (more on this below). This means that although real yields do not explain all the moves in the gold price, they do seem to explain a significant portion of them.
As such, most of the changes in gold prices can be explained by viewing gold as a real asset with 18 years of real duration.
However, consider the large run-up in gold prices in 2005. The first gold Exchange Traded Fund in the U.S. was launched at the end of 2004, so in 2005, gold had a new source of very large investor demand, and this created a structural break in the real yield-adjusted gold price. While real yields explain much of the movements in gold prices, large structural changes in the market can have large impacts on the valuation.
The perception of gold as a “safe haven” asset also has some influence on gold prices. During the credit crisis and the bankruptcy of Lehman Brothers, many market participants expected gold to do very well. Yet gold prices actually declined during the second half of 2008 as the credit crisis intensified. Why? During the credit crisis we saw a spike in the level of real yields, which puts downward pressure on gold prices. But the real yield-adjusted gold price actually rose sharply following the Lehman Bankruptcy. This shows us that while there was a flight-to-quality bid that increased the real yield-adjusted gold price, the impact of higher real yields was larger.
Looking at the real yield-adjusted value of gold several years after the credit crisis, the price of gold in 2013 was very similar to the pre-2008 price – despite the fact that nominal gold prices had risen over 50%. This suggests that any premium in the gold price following the 2008 credit crisis relating to investor risk aversion had been removed. This real yield-adjusted gold price, which adjusts for real yields and an investor’s opportunity cost of holding gold, is a useful barometer for assessing the valuation of gold across different regimes and relative to other assets.
Similarly, the “safe haven” bid for gold has not only been evident, but more prevalent in recent years. For example, in early 2022 gold prices jumped amid Russia’s invasion of Ukraine, despite real yields increasing. Since then, we have seen an unprecedented increase in global central banks’ gold purchases driven in part by an effort to de-dollarize and repatriate their reserves. We have also seen an increase in retail demand, as evidenced by rising ETF flows, especially following the 2024 U.S. election cycle. This “sticky” safe haven buying contributed to a run-up in gold prices, which reached all-time highs in early 2025, decoupling the link between prices and real yields for the time being.
In summary, other factors can and do affect the valuations of gold, such as the launch of new products to access gold (such as gold ETFs), prior gold returns, investor risk appetite, central bank purchases, and government policies, such as India’s efforts to limit gold imports. Additionally, global real yields and the value of the U.S. dollar versus other global currencies may affect gold prices. However, real yield differentials between countries may also influence relative currency levels, so there could be an offsetting effect between these variables.
Nevertheless, we believe that real yields are the single most important factor impacting gold prices. As gold has now become a financial asset, when real yields rise, gold prices should fall if they are to maintain a given level of financial demand relative to investors’ other opportunities. Similarly, when real yields fall, we expect the price of gold to rise in due course.
Investment Takeaways
Investors should be aware of the relationship between gold and real yields because it has important implications for how they think about the role of gold in their portfolios in an asset-allocation and risk-factor framework. Additionally, controlling for the level of real yields allows for a purer picture of what we believe is the underlying value of gold, and it can help investors more precisely determine allocations to gold within their portfolios.
Furthermore, from a diversification standpoint, investors may be well served by allocating to various asset classes, such as gold, that have the potential to mitigate idiosyncratic risks amid a constantly shifting economic, political and investment landscapes.
This article was adapted from “Demystifying Gold Prices,” a Viewpoint published in January 2014 by Nicolas Johnson, who left PIMCO in 2022.
1 Gold.org https://www.gold.org/goldhub/data/gold-etfs-holdings-and-flows#from-login=1 June 2025 Return to content↩

